

Executive Summary – SFY 2026, Q3
To view full QMIA-Q Report, click here.
The QMIA-Q report for State Fiscal Year (SFY) 2026, Quarter 3 (Q3) provides information about the delivery of YES
services for January, February, and March 2026. Where comparable data is available, the report also examines trends
across the past five years of YES implementation. The report continues to undergo substantial revision as new data from
Magellan replaces data that was previously provided by Optum, Medicaid, and DBH.
YES Accomplishments and Updates
Current and Planned Report Enhancements
Current Reporting Period Changes and Enhancements
In response to feedback regarding data clarity and reporting consistency, several enhancements to the QMIA-Q have
been implemented during this reporting period:
- Distinct Utilizer Annual Statewide Metrics Provided: Section 2 now presents statewide annual distinct utilizer counts and utilization rates for YES services and supports across a five-year period (SFY 2022 – SFY 2026-Q3) in sub-sections 2c through 2g. This framework utilizes a 12-month rolling average for each current period. For example, data for SFY 2026-Q3 reflect a 12-month span from April 2025 through March 2026. This methodology will be maintained in future quarterly updates to better facilitate the identification of long-term utilization trends and patterns. As the QMIA-Q report is further refined, traditional reporting of discrete three-month
quarterly counts may be phased out. However, to ensure near-term reporting continuity, SFY 2026-Q3 counts for all YES services and supports remain available in Appendix C. - IBHP Claims Payment Reporting Period Modified: Claims payment data will be reported using a 12-month rolling average (April 2025 – March 2026 for SFY 2026-Q3) rather by quarter-specific claims payment. This transition to a 12-month rolling average aligns with the updated annual services and supports reporting framework and will facilitate annual expenditure comparisons over time.
- Standardized Terminology: The terms penetration and utilization have been updated to align with standard
conventions to promote clearer communication. - Enhanced Data Transparency: To eliminate potential confusion from summarized data distributions, we have replaced summarized data distributions (e.g., averages and distribution low and high points) with tables and figures that include all raw data points. Concurrently, rate and percentage calculations have been largely omitted to prevent misinterpretation.
- New Intensive Care Coordination (ICC) Section: A dedicated data section has been introduced, featuring detailed SFY 2025 data for Magellan ICC and Wraparound services.
Enhancement Roadmap
Work to resolve data gaps and ensure long-term reporting integrity is being undertaken. The following initiatives are
scheduled for integration in the SFY 2026-Q4 report:
- Regional Distinct Utilizers Annual YES Service and Supports Data: Reporting will be expanded to include regional distinct utilizer annual counts and utilization rates for YES Services and Supports (SFYs 2022–2026).
- Comprehensive Data Source Guide: To minimize confusion and clarify appropriate data comparisons, a centralized Data Source Guide will be introduced. This guide will outline the origin of the data and provide a detailed description of data set(s) used in each section. Where feasible, it will replace data-related footnotes and in-text data explanations.
- Expanded Appendix: Additional data definitions will be added to the existing Key Terms report appendix to enhance reader usability.
- Refined CANS Reporting: Child and Adolescent Needs and Strengths (CANS) data will be presented with greater granularity. The report will break down both total completed CANS and initial CANS completions, alongside statewide and regional Level of Care (LOC) scores.
- Residential Care Tracking: Unduplicated counts of youth in residential care—along with key demographics such as region and age—will be available after receiving granular data from Magellan/IBHP. The new data will be integrated with the currently available request and denial data for Residential Treatment Centers (RTC) and Psychiatric Residential Treatment Facilities (PRTF).
YES Performance Improvement Projects (PIPs) Underway
Many YES PIPs continue to be actively focused on during SFY 2026 Q3. These PIPs are aimed at strengthening service quality, system coordination, and measurable outcomes across the YES system of care. Several of these PIPs were carried forward from SFY 2025, SFY 2026 Q1, and SFY 2026 Q2 due to their scope, complexity, and multi-year implementation requirements. Initiatives for each of these PIPs represent targeted efforts by Department staff to enhance service quality, coordination, and outcomes across the YES system of care.
To maintain a concise and focused report, only PIPs demonstrating substantial progress or with meaningful narrative updates during this reporting period are described in Section 10. However, to ensure transparency and provide access to complete information, three appendices (Appendices D, E, F)—are included to present detailed information on all PIPs.
YES Challenges and Opportunities
Ongoing Child and Adolescent Needs and Strengths (CANS) Data Issues
The CANS data required to complete the “Access to YES” section of the QMIA Quarterly Report were not available at the time of report publication. In collaboration with the IBHP Governance Bureau, which oversees Magellan, DBH continues to work toward validating the accuracy and completeness of these data. Progress has been impacted by limitations
within Magellan’s data infrastructure, resulting in ongoing delays.
Interrelated Challenges
Interrelated challenges faced by the YES system, as well as opportunities to grow and improve YES, include the
following:
- the ongoing mental health care workforce shortage
- lack of access to mental health care in rural/frontier areas of Idaho
- increased mental health care need
- the lack of high-intensity services
YES Reports
The following are links to the YES reports noted within the QMIA-Q and/or produced as part of YES quality monitoring and review:
Estimate of Need for Intensive Care Coordination using Wraparound in Idaho, SFY 2025 (June 2025 report)
https://yes.idaho.gov/wp-content/uploads/2025/06/PY3-analysis-of-projected-need-for-ICC-June-2025-FINALsubmitted.pdf
Final Report of the Youth Empowerment Services (YES) Quality Review (SFY 2023-2024)
https://yes.idaho.gov/wpcontent/uploads/2025/01/QRReportFinalReport2023.pdf
Historical QMIA-Q reports
https://yes.idaho.gov/yes-quality-management-improvement-and-accountability/
Idaho YES Family Survey Results, 2025
https://yes.idaho.gov/wp-content/uploads/2025/09/2025-YES-family-survey-results-FINAL-submitted.pdf
Provider Survey of the Youth Empowerment Services Quality Review (FY2023-2024)
https://yes.idaho.gov/wp-content/uploads/2024/04/2023_QR-Report_01-Agency-Survey.pdf
Quality of Mental Health Services for Idaho Youths Living in Foster Care, 2024
https://yes.idaho.gov/wp-content/uploads/2025/02/QualityofMH-servicesIDyouthin-fostercare2024.pdf
Unmet Need for Mental Health Services among Idaho Youth, 2024
https://yes.idaho.gov/wpcontent/uploads/2024/07/2024NeedforMHServicesIdahoYouth.pdf
YES Rights and Resolutions, SFY 2026 Q3
https://yes.idaho.gov/wp-content/uploads/2026/06/YES-Rights-and-Resolutions-SFY-2026-Qtr-3.pdf
Executive Summary – SFY 2026, Q2
To view the Full QMIA-Q Quarterly Report, SFY 2026 2nd Quarter, click here.
The QMIA-Q report for State Fiscal Year (SFY) 2026, Quarter 2 (Q2) provides information about the delivery of YES services for October, November, and December 2025. Where comparable data is available, the report also examines trends across the past five years of YES implementation. The report continues to undergo substantial revision as new data from Magellan replaces data that was previously provided by Optum, Medicaid, and DBH.
YES Accomplishments and Updates
YES Performance Improvement Projects (PIPs) Underway
Many YES PIPs continue to be actively focused on during SFY 2026 Q2. These PIPs are aimed at strengthening service quality, system coordination, and measurable outcomes across the YES system of care. Several of these PIPs were carried forward from SFY 2025, and SFY 2026 Q1 due to their scope, complexity, and multi-year implementation requirements. Initiatives for each of these PIPs represent targeted efforts by Department of Health and Welfare (DHW) staff to enhance service quality, coordination, and outcomes across the YES system of care. Key DHW Divisions involved in this work include DBH, the IBHP Governance Bureau, and Child, Youth, & Family Services (CYFS).
The following eight PIPs are the focus of Section 9 (YES PIPs with Updates for the Current Reporting Period):
• Child and Adolescent Strengths and Needs (CANS) Improvement (DBH)
• Combined Initiative: Wraparound and Out-of-Home Placements (DBW, IBHP, Magellan)
• Interagency Governance Team (IGT) and YES Workgroups and Subcommittees (DBH)
• Mental Health Care for Target Population: Foster Care (CYFS)
• Residential Treatment (IBHP/Magellan)
• Workforce Development (DBH)
• Wraparound (DBH)
• Youth Crisis Services (IBHP/DBH)
To maintain a concise and focused report, only PIPs demonstrating substantial progress or with meaningful narrative updates during this reporting period are described in Section 9. However, to ensure transparency and provide access to complete information, three appendices (Appendices E, F, G) — are included to present detailed information on all PIPs.
YES Challenges and Opportunities
Data Quality and Reporting Improvements
Efforts to strengthen the reliability and validity of data presented in the QMIA Quarterly Report are ongoing. DBH continues to collaborate closely with the IBHP and other partners to ensure that reported data are accurate, comprehensive, and reflective of both the strengths and areas for improvement within the YES system of care.
Recent enhancements have focused on improving readability and internal consistency across the report, including the standardization of table and chart titles, section headings, and key terminology.
Looking ahead, DBH will continue to streamline report design and content while preserving the level of detail necessary to support transparency, accountability, and informed decision-making.
Ongoing Child and Adolescent Needs and Strengths (CANS) Data Issues
The CANS data required to complete the “Access to YES” section of the QMIA Quarterly Report were not available at the time of report publication. In collaboration with the IBHP Governance Bureau, which oversees Magellan, DBH continues to work toward validating the accuracy and completeness of these data. Progress has been impacted by limitations within Magellan’s data infrastructure, resulting in ongoing delays.
Interrelated Challenges
Interrelated challenges faced by the YES system, as well as opportunities to grow and improve YES, include the following:
• the ongoing mental health care workforce shortage
• lack of access to mental health care in rural/frontier areas of Idaho
• increased mental health care need
• the lack of high-intensity services
YES Reports
The following are links to the YES reports noted within the QMIA-Q and/or produced as part of YES quality monitoring and review:
Estimate of Need for Intensive Care Coordination using Wraparound in Idaho, SFY 2025 (June 2025 report)
https://yes.idaho.gov/wp-content/uploads/2025/06/PY3-analysis-of-projected-need-for-ICC-June-2025-FINAL-submitted.pdf
Final Report of the Youth Empowerment Services (YES) Quality Review (SFY 2023-2024)
https://yes.idaho.gov/wp-content/uploads/2025/01/QRReportFinalReport2023.pdf
Historical QMIA-Q reports
https://yes.idaho.gov/yes-quality-management-improvement-and-accountability/
Idaho YES Family Survey Results, 2025
https://yes.idaho.gov/wp-content/uploads/2025/09/2025-YES-family-survey-results-FINAL-submitted.pdf
Provider Survey of the Youth Empowerment Services Quality Review (FY2023-2024)
https://yes.idaho.gov/wp-content/uploads/2024/04/2023_QR-Report_01-Agency-Survey.pdf
Quality of Mental Health Services for Idaho Youths Living in Foster Care, 2024
https://yes.idaho.gov/wp-content/uploads/2025/02/QualityofMH-servicesIDyouthin-fostercare2024.pdf
Unmet Need for Mental Health Services among Idaho Youth, 2024
https://yes.idaho.gov/wp-content/uploads/2024/07/2024NeedforMHServicesIdahoYouth.pdf
YES Rights and Resolutions, SFY 2026 Q2
https://yes.idaho.gov/wp-content/uploads/2026/03/YES-Rights-and-Resolutions-SFY-2026-Qtr-2.pdf
To read the full report, click here.
Executive Summary – SFY 2026, Q1
To view the Full QMIQ Quarterly Report, SFY 2026 1st Quarter, click here.
The QMIA-Q report for State Fiscal Year (SFY) 2026, Quarter 1 (Q1) provides information about the delivery of YES services for July, August, and September 2025. Where comparable data are available, the report also examines trends
across the past five years of YES implementation. The report continues to undergo substantial revision as new data from Magellan replaces data that was previously provided by Optum, Medicaid, and DBH.
YES Accomplishments and Updates
Several YES Performance Improvement Projects (PIPs) Underway
Thirteen YES PIPs were actively implemented during SFY 2026 Q1. PIPs are aimed at strengthening service quality, system coordination, and measurable outcomes across the YES system of care. Several of these PIPs were carried
forward from SFY 2025 due to their scope, complexity, and multi-year implementation requirements.
In Section 9 (YES PIPs Summary), the project goal, progress and status, and performance measurement details
associated with each PIP are provided.
PIPs span the following wide range of YES-related services, supports, and governance structure:
- Residential Treatment
- Interagency Clinical Team (ICT) Transition
- Intensive Home and Community Based Services (IHCBS)
- Child and Family Teams (CFT)
- Treatment Foster Care (TFC)
- Wraparound
- Intensive Care Coordination (ICC)
- Mental Health Care for Target Population: Foster Care
- Combined Initiative: Wraparound and Out-of-Home Placements
- Workforce Development
- Youth Crisis Services
- Child and Adolescent Strengths and Needs (CANS) Improvement
- Interagency Governance Team (IGT) and YES Workgroups and Subcommittees
- Out-of-Home and Out-of-State Placements (discontinued)
Updated and Enhanced Methodology Used to Estimate Number of Potential Class Members
The annual estimate of potential class members was completed in December 2025 using a recent Idaho-specific Serious Emotional Disturbance (SED) prevalence estimate from Substance Abuse and Mental Health Services Administration (SAMHSA). This methodology replaces prior insurance-based prevalence estimates, which relied on national-level data and are no longer considered the most accurate or appropriate data sources. Notably, applying the former prevalence rates to the most recent Census data would have yielded a slightly lower estimate of potential class membership than the estimate produced under the updated methodology.
YES Challenges and Opportunities
Data Quality and Reporting Improvements
Efforts to enhance the reliability and validity of the data presented in the QMIA Quarterly Report are ongoing. DBH continues to collaborate closely with the IBHP and other partners to ensure that the data are accurate, comprehensive,
and reflective of the YES system of care’s strengths and areas for improvement. Additional work is being undertaken to promote internal consistency across the report, including standardization of table and chart titles, section headings, and
terminology. Looking ahead, DBH plans to further streamline future reports while maintaining the depth and detail necessary to support transparency and informed decision-making.
Interrelated Challenges
Interrelated challenges faced by the YES system, as well as opportunities to grow and improve YES, include the following:
- the ongoing mental health care workforce shortage
- lack of access to mental health care in rural/frontier areas of Idaho
- increased mental health care need
- the lack of high-intensity services
YES Reports
The following are links to the YES reports noted within the QMIA-Q and/or produced as part of YES quality monitoring
and review:
Estimate of Need for Intensive Care Coordination using Wraparound in Idaho, SFY 2025 (June 2025 report)
https://yes.idaho.gov/wp-content/uploads/2025/06/PY3-analysis-of-projected-need-for-ICC-June-2025-FINALsubmitted.
pdf
Final Report of the Youth Empowerment Services (YES) Quality Review (SFY 2023-2024)
https://yes.idaho.gov/wp-content/uploads/2025/01/QRReportFinalReport2023.pdf
Historical QMIA-Q reports
https://yes.idaho.gov/yes-quality-management-improvement-and-accountability/
Idaho YES Family Survey Results, 2025
https://yes.idaho.gov/wp-content/uploads/2025/09/2025-YES-family-survey-results-FINAL-submitted.pdf
Provider Survey of the Youth Empowerment Services Quality Review (FY2023-2024)
https://yes.idaho.gov/wp-content/uploads/2024/04/2023_QR-Report_01-Agency-Survey.pdf
Quality of Mental Health Services for Idaho Youths Living in Foster Care, 2024
https://yes.idaho.gov/wp-content/uploads/2025/02/QualityofMH-servicesIDyouthin-fostercare2024.pdf
Unmet Need for Mental Health Services among Idaho Youth, 2024
https://yes.idaho.gov/wp-content/uploads/2024/07/2024NeedforMHServicesIdahoYouth.pdf
YES Rights and Resolutions, SFY 2026 Q1
https://yes.idaho.gov/wp-content/uploads/2025/12/YES-Rights-and-Resolutions-SFY-2026-Qtr-1.pdf
To read the full report, click here.
Report Purpose
In collaboration with the Division of Behavioral Health (DBH), the Idaho Behavioral Health Plan (IBHP) Governance Bureau has engaged extensively with the IBHP contractor, Magellan Healthcare, Inc. (Magellan) to validate all State Fiscal Year (SFY) Youth Empowerment Services (YES) 2025 Quality Management Improvement and Accountability (QMIA) Quarterly Report service utilization and expenditure data.
This stand-alone report presents corrected and fully validated Medicaid and non-Medicaid (DBH) service utilization and expenditure data for all four quarters of SFY 2025. In addition, Quarter 3 service utilization and expenditure data are included for the first time, as these data were unavailable at the time of publication of the SFY 2025 Quarter 3 QMIA Quarterly Report.
Finally, this report incorporates non-Medicaid (DBH) service utilization and expenditure data that were inadvertently omitted from previous QMIA Quarterly Reports. The inclusion of these data reflects a commitment to comprehensive reporting and ensures full representation of all YES-related services delivered through the IBHP, along with associated payments.
To read the full report, click here.
Executive Summary – SFY 2025, Q4
The QMIA-Q report for State Fiscal Year (SFY) 2025, Quarter 4 (Q4) provides information about the delivery of YES services for April, May, and June 2025. Where comparable data are available, the report also examines trends across the past five years of YES implementation. The report continues to undergo substantial revision as new data from Magellan replaces data that was previously provided by Optum, Medicaid, and DBH.
YES Accomplishments and Updates
2025 YES Family Survey Findings Demonstrated System-Wide Improvement
From 2024 to 2025, family ratings improved on 32 of 34 YES Quality Indicators. Three access-related quality indicators had particularly strong improvement between 2024 and 2025 – ability to easily access services, ability to get services in local community, and ability to access recommended services. The survey also provided evidence that access to mental health services improved for youth with the most intensive needs while simultaneously indicating that substantial room for continued improvement in this area remains. Additional survey findings are provided in Section 8 (YES Quality Monitoring Results) and a link to the full 2025 YES Family Survey report is provided in the YES Reports section below.
Several YES Performance Improvement Projects (PIPs) Underway
Nine YES PIPs, focused on strengthening service quality, system coordination, and outcomes across the YES system of care, were actively implemented in SFY 2025 and many will continue into SFY 2026.
In Section 9 (YES PIPs Summary), the project goal, progress and status, and performance measurement details associated with each PIP are provided.
PIPs span the following wide range of YES-related services, supports, and governance structure:
- Wraparound
- Intensive Care Coordination (ICC)
- Mental Health Care for Target Population: Foster Care
- Out-of-Home and Out-of-State Placement
- Combined Initiative: Wraparound and Out-of-Home/Out-of-State Placement
- CANS Improvement
- Workforce Development
- IGT Workgroups and Subcommittees
- Crisis Services
New and Updated Data
This report introduces new and updated data elements not previously included in the QMIA Quarterly Report for SFY 2025. Specifically, it adds Intensive Care Coordination (ICC) data and utilizes a new reporting approach for Psychiatric Residential Treatment Facility (PRTF) and Residential Treatment Center (RTC) outcome request data. The information presented in this section is provided in an aggregated format, with plans for more detailed, stratified reporting in future quarters. Further information on these reporting enhancements is outlined in Section 5.
A recent cross-division collaboration between DBH and Child, Youth, and Family Services (CYFS) has produced a new analytic data element: a comparative view of Initial CANS scores for youth removed from home versus those who remained at home. Additional details are provided in the YES Partners section (Section 6).
YES Challenges and Opportunities
Data Quality and Reporting Improvements
Efforts to enhance the reliability and validity of the data presented in the QMIA Quarterly Report are ongoing. DBH continues to collaborate closely with the IBHP and other partners to ensure that the data are accurate, comprehensive, and reflective of the YES system of care’s strengths and areas for improvement. Additional work is being undertaken to promote internal consistency across the report, including standardization of table and chart titles, section headings, and terminology. Looking ahead, DBH plans to further streamline future reports while maintaining the depth and detail necessary to support transparency and informed decision-making.
In collaboration with DBH, the IBHP has engaged extensively with Magellan to validate all SFY 2025 QMIA Quarterly Report service and expenditure data. This SFY 2025-Q4 report presents Quarter 4 data only. A separate, stand-alone report containing corrected data for all four quarters will be posted on the YES Website no later than December 31, 2025.
New and Updated Data Elements in SFY 2026
Beginning as early as possible in SFY 2026, the QMIA Quarterly will incorporate YES Screener data and expanded analyses of YES expenditure patterns. The report will also include any reliable year-over-year comparisons of acute psychiatric hospitalizations before and after SFY 2025, to the extent that reporting differences allow for valid analysis. In addition, geographic mapping of initial CANS scores at the county level will resume, with planned enhancements to improve visual clarity and overall presentation.
Interrelated Challenges
Interrelated challenges faced by the YES system, as well as opportunities to grow and improve YES, include the following:
- the ongoing mental health care workforce shortage
- lack of access to mental health care in rural/frontier areas of Idaho
- increased mental health care need
- the lack of high-intensity services
YES Reports
The following are links to the YES reports noted within the QMIA-Q and/or produced as part of YES quality monitoring and review:
Estimate of Need for Intensive Care Coordination using Wraparound in Idaho, SFY 2025 (June 2025 report)
Final Report of the Youth Empowerment Services (YES) Quality Review (SFY 2023-2024)
https://yes.idaho.gov/wp-content/uploads/2025/01/QRReportFinalReport2023.pdf
Historical QMIA-Q reports
https://yes.idaho.gov/yes-quality-management-improvement-and-accountability/
Idaho YES Family Survey Results, 2025
https://yes.idaho.gov/wp-content/uploads/2025/09/2025-YES-family-survey-results-FINAL-submitted.pdf
Provider Survey of the Youth Empowerment Services Quality Review (FY2023-2024)
https://yes.idaho.gov/wp-content/uploads/2024/04/2023_QR-Report_01-Agency-Survey.pdf
Quality of Mental Health Services for Idaho Youths Living in Foster Care, 2024
https://yes.idaho.gov/wp-content/uploads/2025/02/QualityofMH-servicesIDyouthin-fostercare2024.pdf
Unmet Need for Mental Health Services among Idaho Youth, 2024
https://yes.idaho.gov/wp-content/uploads/2024/07/2024NeedforMHServicesIdahoYouth.pdf
YES Rights and Resolutions, SFY 2025 Q4
https://yes.idaho.gov/wp-content/uploads/2025/10/YES-Rights-and-Resolutions-SFY-2025-Qtr-4.pdf
To read the full report, click here.
Executive Summary – SFY 2025, Q3
The QMIA-Q report for State Fiscal Year (SFY) 2025, Quarter 3 (Q3) provides information about the delivery of YES services for January, February, and March 2025 and trends over the past five years of YES implementation. The report will be undergoing substantial revision throughout SFY 2025 as new data from Magellan replaces data that was previously provided by Optum, Medicaid, and DBH.
YES Accomplishments and Updates
IBHP Expansion of Mobile Response Teams (MRT) and Collaboration with the Idaho Crisis and Suicide Hotline (ICSH)
When Magellan assumed the role of IBHP managed care contractor, it partnered with ICSH to support a new platform for tracking 988 crisis calls. This platform also supports the statewide deployment of MRTs.
During the first two quarters of SFY 2025 (July – December 2024), MRTs were available Monday through Friday from 8:00 AM to 6:00 PM MST. During this period, MRTs served 12 youth in crisis. In the second half of the fiscal year (January – June, 2025), the teams have operated from 8:00 AM to 11:00 PM MST, Monday through Friday. As of mid-May 2025, MRTs had served 15 youth in crisis. As of July 1, 2025, the MRTs are available, 24/7, 365 days a year, ensuring continuous support for those in need.
Changes to Care Coordination Services
At the close of 2024, Medicaid’s Targeted Care Coordination (TCC) services were phased out and replaced by Intensive Care Coordination (ICC) for youth, now provided by Magellan. ICC services are delivered by a team of licensed clinicians within Magellan’s clinical staff, ensuring specialized, high-quality care.
Wraparound services, which were previously provided solely by DBH, are now primarily delivered by community providers. This shift follows a significant reduction in Wraparound capacity during DBH’s organizational restructure, when the agency transitioned away from direct service provision. In response, Magellan is actively working to restore and expand Wraparound capacity by broadening its network of community providers. This effort aims to enhance service delivery and strengthen support for youth with intensive mental health needs.
Previously, TCC was available only to Medicaid-enrolled youth, while Wraparound primarily served youth without Medicaid coverage. Under the new model, youth with and without Medicaid may qualify for ICC and Wraparound, with potential coverage provided by Magellan. While TCC providers played a critical role in supporting youth, the expansion of ICC and Wraparound services within the system of care will increases access to much-needed, intensive care coordination for youth—regardless of their Medicaid status—across Idaho communities.
DBH Center of Excellence Promotes Best Practices
Three DBH Centers of Excellence (CoEs) are dedicated to advancing youth services and supports. Each CoE collaborates closely with stakeholders and providers to promote best practices through training, mentoring, and fidelity monitoring.
Key highlights from the CoEs include:
- Wraparound CoE: As of June 2025, there are 37 fully trained Wraparound coordinators serving communities across Idaho.
- Parenting with Love and Limits (PLL) CoE: In June 2025, Magellan expanded the PLL provider network by selecting an additional 5–6 agencies to deliver services. New certification trainings are scheduled for August and September 2025 to onboard these providers.
- Idaho Transformation Collaborative Outcomes Management (TCOM) Institute CoE: TCOM is dedicated to standardizing the use of the Child Adolescent Needs and Strengths (CANS) and the Crisis Assessment Tool (CAT). As of July 31st 2025, a total of 1,850 TCOM certifications have been issued to Idaho providers, including 1,510 for the CANS and 72 for the CAT.
For further details on additional CoE highlights and accomplishments, please refer to Section 4c.
Treatment Foster Care Program Advancing
Treatment Foster Care (TFC) supports youth with Serious Emotional Disturbance (SED) in community-based family settings. It serves youth aged 3-18 whose needs exceed less restrictive options, as determined by the Child and Family Team (CFT) and the Decision Support tool. TFC helps build skills for successful reunification and can also stabilize youth to prevent or step down from higher levels of care. This service involves a partnership with the Division of Child, Youth, and Family Services (CYFS) and DBH for youth in state custody or at risk of entering care due to unmet behavioral or mental health needs.
As of April 2025, there are seven licensed Therapeutic Foster Care (TFC) provider families, with two additional families currently in training. At present, four youth are in placement and three are preparing to transition from residential care to the newly available TFC homes. Acknowledging the critical need for this service, the Idaho Department of Health and Welfare (IDHW) is actively developing strategies to expand TFC accessibility. Due to limited provider availability and high demand, TFC is currently only available to youth in state custody. However, it is anticipated that by fiscal year 2026, TFC will be expanded to serve other eligible candidates. To ensure the sustainability of TFC, DBH and the IBHP team are collaborating on a long-term goal to make TFC a Medicaid-billable service.
YES Challenges and Opportunities
YES System Data-Related Issues Are Slowly but Steadily Being Resolved
While many of the initial YES system data-related challenges associated with the implementation of the new IBHP have been addressed, some work to ensure new data is accurately reflecting work being done by DBH and Magellan providers remains. This is due to changes in data formats as well as the need to align definitions to ensure that historical comparisons are both reliable (consistent over time) and valid (accurately measuring the intended metrics).
Interrelated Challenges
Interrelated challenges faced by the YES system, as well as opportunities to grow and improve YES, include the following:
- the ongoing mental health care workforce shortage
- lack of access to mental health care in rural/frontier areas of Idaho
- increased mental health care need
- the lack of high-intensity services
YES Reports
The following are links to the YES reports noted within the QMIA-Q and/or produced as part of YES quality monitoring and review:
Estimate of Need for Intensive Care Coordination using Wraparound in Idaho, SFY 2025 (June 2025 report)
https://yes.idaho.gov/wp-content/uploads/2025/06/PY3-analysis-of-projected-need-for-ICC-June-2025-FINAL-submitted.pdf
Final Report of the Youth Empowerment Services (YES) Quality Review (SFY 2023-2024)
https://yes.idaho.gov/wp-content/uploads/2025/01/QRReportFinalReport2023.pdf
Historical QMIA-Q reports
https://yes.idaho.gov/yes-quality-management-improvement-and-accountability/
Idaho YES Family Survey Results, 2024
https://yes.idaho.gov/wp-content/uploads/2024/07/2024YESFamilySurveyResults.pdf
Provider Survey of the Youth Empowerment Services Quality Review (FY2023-2024)
https://yes.idaho.gov/wp-content/uploads/2024/04/2023_QR-Report_01-Agency-Survey.pdf
Quality of Mental Health Services for Idaho Youths Living in Foster Care, 2024
https://yes.idaho.gov/wp-content/uploads/2025/02/QualityofMH-servicesIDyouthin-fostercare2024.pdf
Unmet Need for Mental Health Services among Idaho Youth, 2024
https://yes.idaho.gov/wp-content/uploads/2024/07/2024NeedforMHServicesIdahoYouth.pdf
To read the full report, click here.
Executive Summary – SFY 2025, Q2
The QMIA-Q report for State Fiscal Year (SFY) 2025, Quarter 2 (Q2) provides information about the delivery of YES services for October, November, and December 2024 and trends over the past five years of YES implementation. The report will be undergoing substantial revision throughout SFY 2025 as new data from Magellan replaces data that was previously provided by Optum, Medicaid, and DBH.
YES Accomplishments and Updates
Expansion of Inpatient Services
In the second quarter of SFY 2025, there was a significant increase in the number of claims paid for all types of inpatient care. Inpatient acute hospital claims paid increased by 127%, rising from 201 in Q1 to 457 in Q2. Similarly, claims paid for Psychiatric Residential Treatment Facility (PRTF) saw a 143% jump, increasing from 35 in Q1 to 85 in Q2. Additionally, 22 Residential Treatment Center (RTC) claims were paid in Q2, compared to zero in Q1.
IBHP Expansion of Mobile Response Teams (MRT) and Collaboration with the Idaho Crisis and Suicide Hotline (ICSH)
When Magellan assumed the role of IBHP managed care contractor, it partnered with ICSH to support a new platform for tracking 988 crisis calls. This platform also supports the statewide deployment of MRTs.
During the first two quarters of SFY 2025 (July – December 2024), MRTs were available Monday through Friday from 8:00 AM to 6:00 PM MST. During this period, MRTs served 12 youth in crisis. In the second half of the fiscal year (January – June, 2025), the teams have been/will operate from 8:00 AM to 11:00 PM MST, Monday through Friday. As of mid-May 2025, MRTs have served 15 youth in crisis. Starting July 1, 2025, the MRTs will be available, 24/7, 365 days a year, ensuring continuous support for those in need.
Changes to Care Coordination Services
At the close of 2024, Medicaid’s Targeted Care Coordination (TCC) services were phased out and replaced by Intensive Care Coordination (ICC) for youth, now provided by Magellan. ICC services are delivered by a team of licensed clinicians within Magellan’s clinical staff, ensuring specialized, high-quality care.
Wraparound services, which were previously provided solely by DBH, are now primarily delivered by community providers. This shift follows a significant reduction in Wraparound capacity during DBH’s organizational restructure, when the agency transitioned away from direct service provision. In response, Magellan is actively working to restore and expand Wraparound capacity by broadening its network of community providers. This effort aims to enhance service delivery and strengthen support for youth with intensive mental health needs.
Previously, TCC was available only to Medicaid-enrolled youth, while Wraparound primarily served youth without Medicaid coverage. Under the new model, youth with and without Medicaid may qualify for ICC and Wraparound, with potential coverage provided by Magellan. While TCC providers played a critical role in supporting youth, the expansion of ICC and Wraparound services within the system of care will increases access to much-needed, intensive care coordination for youth—regardless of their Medicaid status—across Idaho communities.
DBH Center of Excellence Promotes Best Practices
Three DBH Centers of Excellence (CoEs) are dedicated to advancing youth services and supports. Each CoE collaborates closely with stakeholders and providers to promote best practices through training, mentoring, and fidelity monitoring. Key highlights from the CoEs include:
- Wraparound CoE: In January 2025, seven new providers joined the Magellan Network to deliver Wraparound. In the following month, February 2025, the Wraparound CoE launched a second cohort of Wraparound Foundation training with 27 new Wraparound coordinators. This training cohort is scheduled to conclude in early June. By July 1, 2025, there will be a total of 37 trained Wraparound coordinators serving communities across Idaho.
- Parenting with Love and Limits (PLL) CoE: The PLL CoE hosted two certification trainings in August and September 2024. As a result, six of the nine agencies selected by Magellan to provide PLL services became officially certified. As of April 2025, 13 PLL group cohorts, serving a total of 43 youth and families, have actively engaged in the program.
- Idaho Transformation Collaborative Outcomes Management (TCOM) Institute: TCOM is dedicated to standardizing the use of the Child Adolescent Needs and Strengths (CANS) and the Crisis Assessment Tool (CAT). Two new trainings have launched for DHW employees and will be offered to community partners in May 2025. These sessions focus on the Ethics of Consensus-Based Assessment and how to use the CANS in practice with an emphasis on strengths-based treatment. Between January and April, an average of 10 trainings were conducted each month, engaging approximately 100 participants monthly. Both the number of trainings and participant engagement are expected to grow steadily throughout the remainder of 2025.
For further details on additional CoE highlights and accomplishments, please refer to Section 4c.
Treatment Foster Care Program Advancing
Treatment Foster Care (TFC) supports youth with Serious Emotional Disturbance (SED) in community-based family settings. It serves youth aged 3-18 whose needs exceed less restrictive options, as determined by the Child and Family Team (CFT) and the Decision Support tool. TFC helps build skills for successful reunification and can also stabilize youth to prevent or step down from higher levels of care. This service involves a partnership with the Division of Child, Youth, and Family Services (CYFS) and DBH for youth in state custody or at risk of entering care due to unmet behavioral or mental health needs.
As of April 2025, there are seven licensed Therapeutic Foster Care (TFC) provider families, with two additional families currently in training. At present, four youth are in placement and three are preparing to transition from residential care to the newly available TFC homes. Acknowledging the critical need for this service, the Idaho Department of Health and Welfare (IDHW) is actively developing strategies to expand TFC accessibility. Due to limited provider availability and high demand, TFC is currently only available to youth in state custody. However, it is anticipated that by fiscal year 2026, TFC will be expanded to serve other eligible candidates. To ensure the sustainability of TFC, DBH and the IBHP team are collaborating on a long-term goal to make TFC a Medicaid-billable service.
YES Challenges and Opportunities
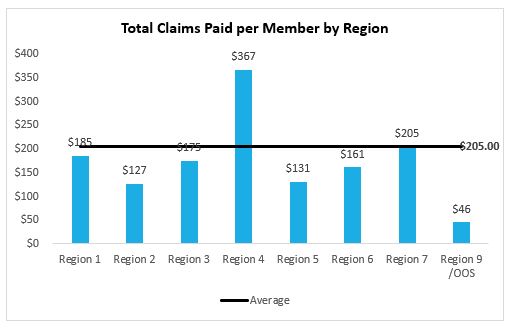
Wide Spending Gaps Across Regions Persist
There are persistent spending disparities across regions. As demonstrated in the figure below, the total claims paid per eligible Medicaid member in Region 4 significantly surpasses not only the average spending, but also exceeds the spending in Region 5 by almost three times. While the data presented here are based solely on SFY 2025-Q2 information, the observed trend is consistent with the expenditure patterns reported in previous quarters.
Accurately Comparing New Magellan Data to Historical Data Will Require Time and Careful Analysis
The information provided by Magellan is highly valuable, and many initial challenges have already been addressed. However, making accurate comparisons to historical QMIA quarterly data will be a time-consuming process. This is due to changes in data formats, and the need to carefully align definitions and coding to ensure that historical comparisons are both reliable (consistent over time) and valid (accurately measuring the intended metrics).
Interrelated Challenges
Interrelated challenges faced by the YES system, as well as opportunities to grow and improve YES, include the following:
- the ongoing mental health care workforce shortage
- lack of access to mental health care in rural/frontier areas of Idaho
- increased mental health care need the lack of high-intensity services
YES Reports
The following are links to the YES reports noted within the QMIA-Q and/or produced as part of YES quality monitoring and review:
Biannual Estimate of Need for Intensive Care Coordination using Wraparound in Idaho, SFY 2024 (June 2024 report)
https://yes.idaho.gov/wp-content/uploads/2024/07/ICCAnalysisProjectedNeedJune2024.pdf
Final Report of the Youth Empowerment Services (YES) Quality Review (SFY 2023-2024)
https://yes.idaho.gov/wp-content/uploads/2025/01/QRReportFinalReport2023.pdf
Historical QMIA-Q reports
https://yes.idaho.gov/yes-quality-management-improvement-and-accountability/
Idaho YES Family Survey Results, 2024
https://yes.idaho.gov/wp-content/uploads/2024/07/2024YESFamilySurveyResults.pdf
Provider Survey of the Youth Empowerment Services Quality Review (FY2023-2024)
https://yes.idaho.gov/wp-content/uploads/2024/04/2023_QR-Report_01-Agency-Survey.pdf
Quality of Mental Health Services for Idaho Youths Living in Foster Care, 2024
https://yes.idaho.gov/wp-content/uploads/2025/02/QualityofMH-servicesIDyouthin-fostercare2024.pdf
Unmet Need for Mental Health Services among Idaho Youth, 2024
https://yes.idaho.gov/wp-content/uploads/2024/07/2024NeedforMHServicesIdahoYouth.pdf
To read the full report, please click here.
Executive Summary – SFY 2025, Q1
The QMIA-Q report for State Fiscal Year (SFY) 2025, Quarter 1 (Q1) provides information about the delivery of YES services for July, August, and September 2024 and trends over the past five years of YES implementation. The report will be undergoing substantial revision throughout SFY 2025 as new data from Magellan replaces data that was previously provided by Optum, Medicaid, and DBH.
YES Accomplishments and Updates
New Data is Available for Assessing YES
Several new data elements have been incorporated into the QMIA Quarterly Report. The inclusion of many of these items stems from valuable information provided by Magellan specifically for this report. These additions include, but are not limited to:
- Expanded Expenditure Data: Quarterly claims paid data now includes more granular details, such as total claims, outpatient claims, inpatient claims, and residential claims. This enhancement allows for a more detailed and nuanced understanding of how funds are allocated across the YES system (see Section 3).
- New Outpatient Service Data: We can now track and report on additional outpatient services, including Comprehensive Diagnostic Assessments, Interpretative Services, and Emergency Department visits. This data can be analyzed over time, offering deeper insights into service utilization and trends (see Section 2).
- Increased Array of Intensive Home and Community-Based Services (IHCBS): The scope of IHCBS data has expanded, allowing for more precise reporting on service utilization across various IHCBS modalities. This provides a clearer picture of how these services are being utilized within the YES system (see Section 2).
DBH Center of Excellence Promotes Best Practices
Three DBH Centers of Excellence (CoEs) are dedicated to advancing youth services and supports. Each CoE collaborates closely with stakeholders and providers to promote best practices through training, mentoring, and fidelity monitoring. Key highlights from the CoEs include:
- Wraparound CoE: In September 2024, the Wraparound CoE launched its inaugural training cohort, with 10 members successfully completing their training by early January 2025. Currently, 53 youth are enrolled in the Wraparound program, with services being delivered by two agencies and the Wraparound CoE. Notably, the CoE directly provides Wraparound services to youth and families whose income exceeds 300% of the Federal Poverty Level.
- Parenting with Love and Limits (PLL) CoE: The PLL CoE hosted two certification trainings in August and September 2024. As a result, six of the nine agencies selected by Magellan to provide PLL services became officially certified. As of December 2024, five PLL group cohorts, serving a total of 18 youth and families, are actively engaged in the program.
- Idaho Transformation Collaborative Outcomes Management (TCOM) Institute: TCOM is dedicated to standardizing the use of the Child Adolescent Needs and Strengths (CANS) and the Crisis Assessment Tool (CAT). In 2024, TCOM conducted 40 training sessions on CANS and CAT, engaging 345 participants.
For further details on additional CoE highlights and accomplishments, please refer to Section 4c.
Treatment Foster Care Program Advancing
Treatment Foster Care (TFC) supports youth with Serious Emotional Disturbance (SED) in community-based family settings. It serves youth aged 3-18 whose needs exceed less restrictive options, as determined by the Child and Family Team (CFT) and the Decision Support tool. TFC helps build skills for successful reunification and can also stabilize youth to prevent or step down from higher levels of care. This service involves a partnership with the Division of Child Youth and Family Services (CYFS) and DBH for youth in state custody or at risk of entering care due to unmet behavioral or mental health needs.
As of December 2025, there were five licensed TFC provider families and one in training. Due to limited provider availability and high need, TFC is currently only available for youth in state custody. In fiscal year 2026, TFC will expand to other candidates. DBH is working with the IBHP team to explore additional funding opportunities and make TFC a fully Medicaid-billable service.
Temporary Housing Program for Youth in Foster Care Terminated
In November 2024, DHW ended its practice of using short-term rentals to temporarily house foster children with complex needs while they awaited more permanent placements. The program primarily housed children with health conditions, developmental disabilities, and teens, who were more challenging to place in foster care than their younger counterparts. The department was able to end the temporary housing program for two key reasons. First, the ratio of foster families to foster children in Idaho is increasing. Second, a new assessment center absorbed demand.
Annual Estimated Number of Potential Class Members – October 2024
Type of insurance | |||||
Employer | Non-Group | Medicaid | Uninsured | Total | |
Insured Rate Based on 2022 Estimated Census | 47.9% | 7.5% | 37.5% | 5.3% | |
Population | 231,800 | 36,100 | 181,600 | 25,500 | |
Estimated Prevalence | 6% | 6% | 8% | 11.9% | |
Estimated Need | 13,908 | 2,166 | 14,528 | 3,035 | |
Expected Utilization Lower Estimate 15% | 2,086 | 325 | 14,528 | 3,035 | 19,974 |
Expected Utilization Higher Estimate 18% | 2,503 | 390 | 14,528 | 3,035 | 20,456 |
Appendix B includes insurance definitions and calculation details.
YES Challenges and Opportunities
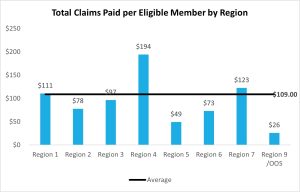
Wide Spending Gaps Exist Across Regions
There are persistent spending disparities across regions. As shown in the figure below, the total claims paid per eligible Medicaid member in Region 4 significantly surpasses not only the average spending but also exceeds the spending in Region 5 by more than three times. While the data presented here is based solely on SFY 2025-Q1 information, the trend observed is consistent with the outpatient expenditure patterns reported in previous quarters.
Accurately Comparing New Magellan Data to Historical Data Will Require Time and Careful Analysis
The information provided by Magellan is highly valuable, and many initial challenges have already been addressed. However, making accurate comparisons to historical QMIA Quarterly data will be a time-consuming and complex process. This is due to changes in data formats, and the need to carefully align definitions and coding to ensure that historical comparisons are both reliable (consistent over time) and valid (accurately measuring the intended metrics).
Interrelated Challenges
Interrelated challenges faced by the YES system, as well as opportunities to grow and improve YES, include the following:
- the ongoing mental health care workforce shortage
- lack of access to mental health care in rural/frontier areas of Idaho
- increased mental health care need
- the absence of high-intensity services
YES Reports
The following are links to the YES reports noted within the QMIA-Q and/or produced as part of YES quality monitoring and review:
Biannual Estimate of Need for Intensive Care Coordination using Wraparound in Idaho, SFY 2024 (June 2024 report)
https://yes.idaho.gov/wp-content/uploads/2024/07/ICCAnalysisProjectedNeedJune2024.pdf
Final Report of the Youth Empowerment Services (YES) Quality Review (SFY 2023-2024)
https://yes.idaho.gov/wp-content/uploads/2025/01/QRReportFinalReport2023.pdf
Historical QMIA-Q reports
https://yes.idaho.gov/yes-quality-management-improvement-and-accountability/
Idaho YES Family Survey Results, 2024
https://yes.idaho.gov/wp-content/uploads/2024/07/2024YESFamilySurveyResults.pdf
Provider Survey of the Youth Empowerment Services Quality Review (FY2023-2024)
https://yes.idaho.gov/wp-content/uploads/2024/04/2023_QR-Report_01-Agency-Survey.pdf
Quality of Mental Health Services for Idaho Youths Living in Foster Care, 2024
https://yes.idaho.gov/wp-content/uploads/2025/02/QualityofMH-servicesIDyouthin-fostercare2024.pdf
Unmet Need for Mental Health Services among Idaho Youth, 2024
https://yes.idaho.gov/wp-content/uploads/2024/07/2024NeedforMHServicesIdahoYouth.pdf
To read the full QMIA Quarterly report, click here.
Executive Summary – Q3
The purpose of the QMIA-Q is to provide YES Partners and children’s mental health stakeholders with information about the children and youth accessing YES services, the services they are accessing, and the outcomes of the services. The data in the QMIA-Q tells the story about whether YES is reaching the children, youth and families who need mental health services, if the services are meeting their needs, and if they are improving as result of the services. The 3rd Quarter 2022 QMIA-Q report includes data from January, February, and March 2022, and trend data from previous quarters and SFYs.
Some of the key points data in the Q3 QMIA-Q are the total number of Medicaid children and youth served , YES Medicaid Outpatient Services Provided by type and region, and Outcomes/Impact of Care.
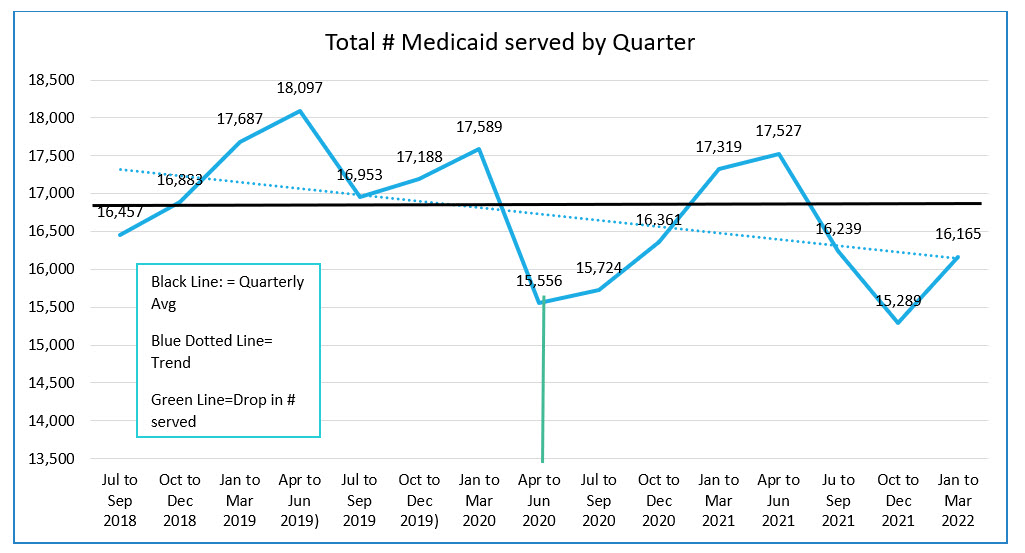
Access to Services
The number of Medicaid members under the age of 18 served has varied over the last 15 quarters with the high number being 18,097 in April – June 2019, and the low of 15,289 in October – December of 2021. The average number of Medicaid served over the last 15 quarters is 16,736 (represented by the solid black line). The overall trend has been decreasing (shown by the blue dotted line) . The cause of the decrease is not known however may be due at least partially to COVID as the initial large drop did occur in about April to June of 2020 (shown by solid green line).
Medicaid Outpatient services by type and region
The following table shows the outpatient services provided to Medicaid members under the age of 18 are noted by type of service and the region in which the service is delivered. The number served is 2022 year-to-date ( quarters 1, 2, and 3) and is unduplicated within the specific category of services (e.g., the number children and youth who received that specific service).
Of outpatient services such as CANS Assessments, Psych and Neuropsych Testing, Psychotherapy, Medication Management, Skills Building, Targeted Care Coordination, Substance Use, Crisis Intervention, Child and Family Interdisciplinary Teams are available statewide. Behavior Assessments, Skills Training and Development (STAD), and Behavioral Modification and Consultation are not available statewide.
Intensive outpatient services such as Partial Hospitalization, Day Treatment, and Intensive home and Community based services are not available statewide and overall appear to be very limited even in regions in which they are available.
It is notable that services in Regions 2 and 6 appear to be the most limited.
SFY 2022, YTD (Q1, Q2 & Q3) | 1 | 2 | 3 | 4 | 5 | 6 | 7 | Out of state | Total |
Distinct Utilizers | Distinct Utilizers | Distinct Utilizers | Distinct Utilizers | Distinct Utilizers | Distinct Utilizers | Distinct Utilizers | Distinct Utilizers | Distinct Utilizers | |
Assessments | |||||||||
CANS- Billed to Medicaid | 1078 | 284 | 2,395 | 2,926 | 1,215 | 669 | 2,593 | 27 | 11,100 |
Psych and Neuropsych Testing | 169 | 65 | 272 | 354 | 132 | 221 | 297 | 6 | 1,754 |
Behavior Assessment | 37 | 0 | 15 | 53 | 0 | 0 | 0 | 0 | 119 |
Outpatient Treatment Services | |||||||||
Psychotherapy | 1,722 | 583 | 3,547 | 4,274 | 1,879 | 1,119 | 3,639 | 67 | 16,593 |
Med Management | 185 | 184 | 1,028 | 1,289 | 343 | 385 | 744 | 14 | 4,113 |
Skills Building (CBRS) | 119 | 113 | 372 | 601 | 70 | 149 | 947 | 7 | 2,348 |
Targeted Care Coordination (TCC) | 27 | 45 | 127 | 244 | 53 | 118 | 536 | 7 | 1,140 |
Substance Use Services | 46 | 9 | 94 | 80 | 142 | 45 | 214 | 4 | 627 |
Crisis Intervention | 34 | 22 | 32 | 25 | 23 | 17 | 184 | 2 | 338 |
Child and Family Interdisciplinary Team (CFIT) | 30 | 22 | 27 | 69 | 56 | 31 | 93 | 0 | 326 |
Skills Training and Development (STAD) | 0 | 29 | 2 | 3 | 100 | 2 | 85 | 1 | 221 |
Behavior Modification and Consultation | 52 | 0 | 12 | 44 | 0 | 0 | 0 | 0 | 107 |
Intensive Outpatient Treatment Services | |||||||||
Partial Hospitalization (PHP) | 0 | 1 | 90 | 126 | 8 | 4 | 12 | 0 | 240 |
Day Treatment | 0 | 0 | 2 | 4 | 28 | 4 | 226 | 1 | 64 |
Intensive Home and Community Based Services (IHCBS) | 0 | 0 | 2 | 14 | 0 | 21 | 9 | 0 | 46 |
Support services | |||||||||
Respite | 6 | 51 | 90 | 186 | 37 | 62 | 211 | 3 | 635 |
Youth Support Services | 4 | 18 | 55 | 204 | 93 | 41 | 104 | 3 | 516 |
Family Psychoeducation | 18 | 0 | 5 | 18 | 102 | 2 | 17 | 0 | 162 |
Outcomes and Impact of Services
YES services are leading to improved outcomes. In Q3 of SFY 2022 the percent of children and youth whose overall rating improved at least one level (e.g., from a 3 to a 2, 1, or 0) remained approximately stable at 35.58%.
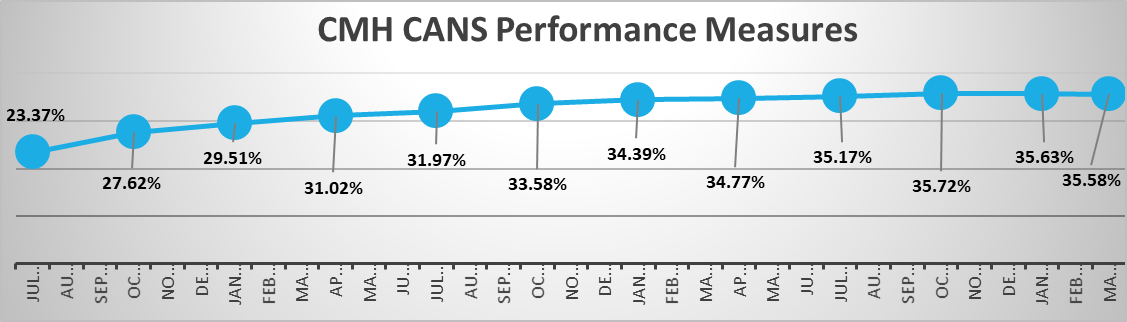
The above method of measuring outcomes is very broad and does not give the kind of detail that can be used to develop plans for how to improve services. For more information about how services are impacting children and youth work has been initiated with Praed to analyze the CANS datafor the impact of services.
The following table is a sample of data from Praed’s analysis of the impact of YES over time for children and youth who stay in services and who have 2 or more CANS in the system.
Description of columns:
- % Presenting: The percentage of youth in the cohort that have an actionable need,
- % Improved: The percentage of youth with any rating over 0 at any CANS Assessment that decreased by 1 point or more at the latest reassessment.
- % Worsened: The percentage of youth with a rating of 2 or lower that subsequently had a rating of 3 at latest assessment.
% Presenting | % Improved | % Worsened | |
Anger Control | 48.7% | 41.2% | 2.2% |
Suicide Watch | 7.7% | 80.6% | .02% |
Psychosis | 3.1% | 67.5% | .01% |
In this sample data we see that approximately 48% of the children and youth with a CANS have issues with Anger Control (48.7%) and at the time of the last CANS assessment for 41% of them it has improved by 1 point or more. When compared with the Suicide Watch for which approximately 8% of the children and youth have actionable issue and at the time of the last CANS assessment for 80% of them it has improved by 1 point or more. When compared with the Psychosis for which approximately 3% of the children and youth have actionable issue and at the time of the last CANS assessment for 67% of them it has improved by 1 point or more. This is an indicator that while YES services seem to be effective for Suicide Watch and Psychosis there may be a need to improve skills in Anger Control interventions.
Executive Summary – SFY 2024, Q4
The QMIA-Q report for State Fiscal Year (SFY) 2024, Quarter 4 (Q4) provides information about the delivery of YES services for April, May, and June 2024 and trends over the past five years of YES implementation. Modifications to the report format initiated in SFY 2023, Quarter 1, intended to make the data provided easier to understand and to facilitate comparisons between regions, have been maintained.
At the time of the original publication of the SFY 2024 Q4 report in October 2024, outpatient service utilization and related expenditure data from the Medicaid/Optum Network were unavailable for inclusion. Following the close of SFY 2024 and the close of the Optum contract, Optum submitted only raw, non-summarized claims data to the IBHP Governance Bureau. The IBHP Governance Bureau team used this data to generate Quarter 4 service utilization counts for all outpatient services, as well as unduplicated annual counts for Intensive Home and Community-Based Services. However, due to data limitations, the team was unable to produce unduplicated SFY 2024 annual counts for other outpatient services.
This updated version of the SFY 2024 Q4 report now incorporates the previously unavailable Medicaid/Optum Network data. All newly added information that was not part of the original publication is clearly marked with the label “Updated Content” in dark blue, bold font in each area or section of the report where new data or analysis has been included. The entirety of Section 5 is updated content.
E1 YES Accomplishments
Increased Access to Intensive Home and Community-Based Services
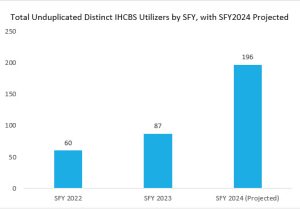
As illustrated in the table below, efforts by DBH and the Medicaid/Optum Network to increase the availability and use of Intensive Home and Community-Based Services (IHCBS) have been partially successful. IHCBS service use in SFY 2024 was more than double the service use in SFY 2023, increasing by 108 unduplicated service utilizers between SFYs.
NOTE: The Optum/Medicaid Network data included in the table below represents unduplicated annual totals.
Intensive Home and Community Based Services Region 1 Region 2 Region 3 Region 4 Region 5 Region 6 Region 7 Total
SFY 2022 Unduplicated Distinct Utilizers 0 0 5 17 0 28 10 60
SFY 2023 Unduplicated Distinct Utilizers 0 2 8 21 2 39 16 87
SFY 2024 Unduplicated Distinct Utilizers
Quarters 1 – 4 8 3 35 76 2 68 3 195
Expansion of Youth Crisis Services
Crisis services for Idaho youth expanded in 2023 and early 2024 with four Youth Crisis Centers (YCCs) opening. The YCCs provide support and services during the early stage of a mental health crisis before more intensive, costly, and restrictive
interventions are required. The YCCs specialize in providing a calm environment for youth aged 12-17 to de-escalate, giving parents and guardians time to re-group during crisis situations. The centers are open 24/7, referrals are not needed, and Law Enforcement may bring youth to the YCCs. However, a parent or guardian must provide treatment consent. Services are 100% voluntary and free of charge, and youth can stabilize for up to 23 hours and 59 minutes.
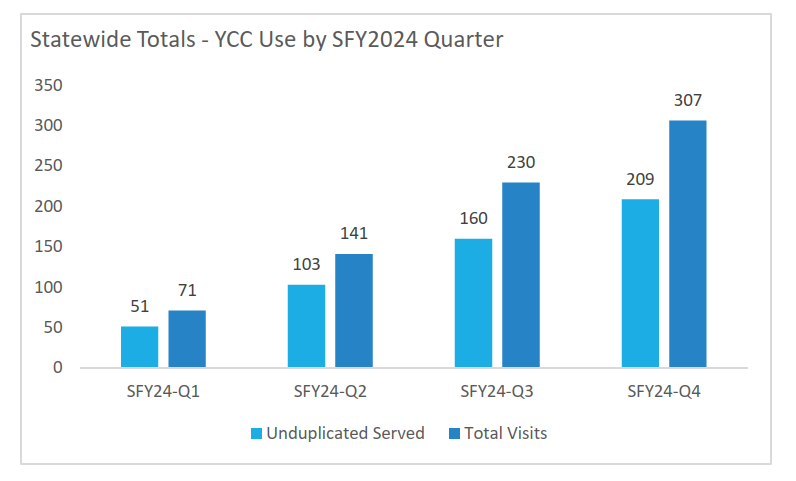
During SFY2024, statewide use of the YCCs in terms of unduplicated number serviced and total visits increased steadily quarter over quarter.
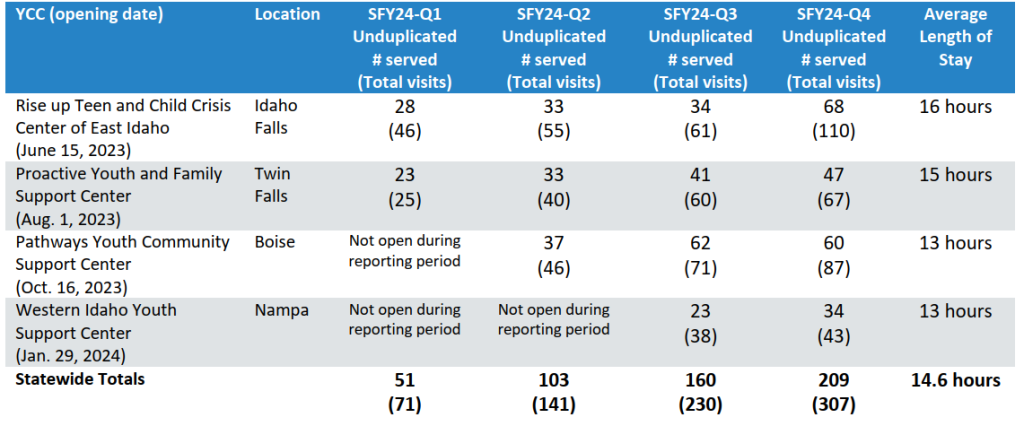
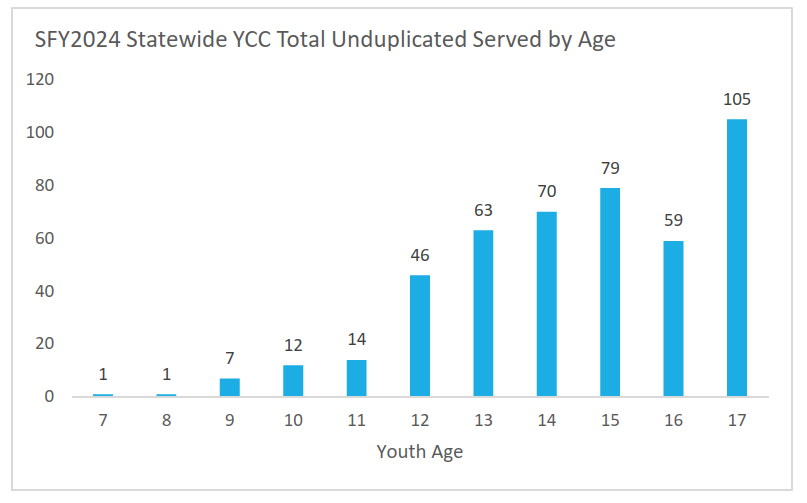
While the YCCS did serve youth ages 7 to 12 years, teenage youth represented most of the unduplicated number served by the YCCs in SFY 2024. Further, 17-year-olds alone accounted for 23% (105 of 457) of the unduplicated youth served in SFY 2024.
E2 YES Challenges and Opportunities
Interrelated On-going System Level Challenges
Interrelated challenges faced by the YES system, as well as opportunities to grow and improve YES, include the following:
- the ongoing mental health care workforce shortage
- lack of access to mental health care in rural/frontier areas of Idaho
- increased mental health care need
- the absence of high-intensity services.
Challenges Particular to SFY 2024
The latter half of SFY 2024 (January – June 2024) included its own short-term difficulties for the YES system. First, the transition of behavioral services to a new Managed Care Organization (MCO) involved a tremendous amount of work across the YES system. YES providers, for example, had to complete the process of contracting with Idaho’s new MCO, Magellan, before the end of June 2024. Further, major efforts had to be undertaken across the YES system to ensure the wide variety of youth clients receiving YES services would be appropriately transitioned to providers in the Magellan network. Second, DBH budget shortfalls resulted in delayed payments to providers.
YES reports:
The following are links to the YES reports noted within the QMIA-Q and/or produced as part of YES Quality monitoring and review:
Idaho YES Family Survey Results, 2024
https://yes.idaho.gov/wp-content/uploads/2024/07/2024YESFamilySurveyResults.pdf
Unmet Need for Mental Health Services among Idaho Youth, 2024
https://yes.idaho.gov/wp-content/uploads/2024/07/2024NeedforMHServicesIdahoYouth.pdf
Biannual Estimate of Need for Intensive Care Coordination using Wraparound in Idaho, SFY 2024 (December 2023 report)
https://yes.idaho.gov/wp-
content/uploads/2024/01/Estimated_Need_ICC_Wraparound_SFY_2024_Dec_2023.pdf
Provider Survey of the Youth Empowerment Services Quality Review (FY2023-2024)
https://yes.idaho.gov/wp-content/uploads/2024/04/2023_QR-Report_01-Agency-Survey.pdf
Final Report of the YES Quality Review (SFY 2022)
https://yes.idaho.gov/wp-content/uploads/2023/01/QR-Report_Final-Report_2022v2.pdf
YES Medicaid Outpatient Utilization, State Fiscal Years, 2020-2023
https://yes.idaho.gov/wp-content/uploads/2023/11/YES-QMIA-Quarterly-Report-Supplement-for-SFY2020-2023-October-2023.pdf
Historical QMIA-Q reports
https://yes.idaho.gov/yes-quality-management-improvement-and-accountability/
View the full SFY 2024 4th Quarter QMIA Report (Updated June 2025)
Executive Summary – SFY 2024, Q3
The QMIA-Q report for State Fiscal Year (SFY) 2024, Quarter 3 (Q3) provides information about the delivery of YES
services for January, February, and March 2024 and trends over the past five years of YES implementation. Modifications
to the report format initiated in SFY 2023, Quarter 1, intended to make the data provided easier to understand and to
facilitate comparisons between regions, have been maintained.
E1 YES Accomplishments
Increased Access to Intensive Home and Community-Based Services
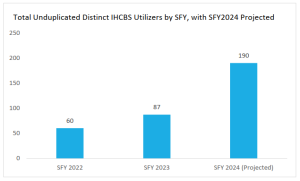
As illustrated in the table and figure below, efforts by DBH and the Medicaid/Optum Network to increase the availability
and use of Intensive Home and Community-Based Services (IHCBS) have been partially successful. The Optum/Medicaid
Network data included in the table and figure represents unduplicated annual totals. The SFY 2024 total of 143 includes
only the year’s first three quarters. If IHCBS service use continues at its current pace in the final quarter of SFY 2024, the
projected annual unduplicated total will be 190. This total is more than double the SFY 2023 total.
Intensive Home and Community Based Services Region 1 Region 2 Region 3 Region 4 Region 5 Region 6 Region 7 Total
SFY 2022 Unduplicated Distinct Utilizers 0 0 5 17 0 28 10 60
SFY 2023 Unduplicated Distinct Utilizers 0 2 8 21 2 39 16 87
SFY 2024 Unduplicated Distinct Utilizers 3 3 27 46 1 55 8 143
Year-to-Date (Q1-Q3)
Expansion of Youth Crisis Services
Crisis services for Idaho youth expanded in 2023 and early 2024 with four Youth Crisis Centers (YCCs) opening. The YCCs
provide support and services during the early stage of a mental health crisis before more intensive, costly, and restrictive
interventions are required. The YBHCCs specialize in providing a calm environment for youth aged 12-17 to de-escalate,
giving parents and guardians time to re-group during crisis situations. The centers are open 24/7, referrals are not
needed, and Law Enforcement may bring youth to the YCCs. However, a parent or guardian must provide treatment
consent. Services are 100% voluntary and free of charge, and youth can stabilize for up to 23 hours and 59 minutes.
| YBHCC (opening date) | Location | SFY24-Q1 | SFY24-Q2 | SFY24-Q3 | Average | |||||||
| Unduplicated | Unduplicated | Unduplicated | Length of Stay | |||||||||
| (Duplicated) | (Duplicated) | (Duplicated) | ||||||||||
| # served | # served | # served | ||||||||||
Rise up Teen and Idaho Falls 28 33 34 16 hours
Child Crisis Center (46) (55) (61)
of East Idaho (June 15, 2023)
| Proactive Youth and Family | Twin Falls | 23 | 33 | 41 | 15 hours | |||||||
| Support Center (Aug. 1, 2023) | (25) | (40) | (60) | |||||||||
Pathways Youth Boise Not open during 37 62 13 hours
Community Support reporting period (46) (71)
Center (Oct. 16, 2023)
| Western Idaho Youth Support | Nampa | Not open during | Not open during | 23 | 13 hours | |||||||
| Center (Jan. 29, 2024) | reporting period | reporting period | (38) | |||||||||
E2 YES Challenges and Opportunities
System of Care Service Availability Regional Highlights
The table below demonstrates that improvement is still needed in access to care across the state and highlights regional variability in service availability within the YES system. Regional penetration rates for Medicaid members accessing YES outpatient services are generally highest in Regions 4 and 7. For example, penetration rates for eight outpatient services in Region 7 are higher than the statewide average, indicating that the YES system has been more highly developed in the Eastern portion of Idaho. Region 4 also has several Outpatient Services with higher-than-average penetration rates. However, the service rates are still lower than desired in all regions, with regions 1 and 5 showing the lowest rates. YES partners have undertaken work to improve access to care.
Selected Penetration Rate for Medicaid Members Accessing YES Outpatient Services by Region
SFY 2024, Q3 | Penetration Rate by Region | |||||||||||||||||
1 | 2 | 3 | 4 | 5 | 6 | 7 | OOS | Average | ||||||||||
Assessments | ||||||||||||||||||
CANS Billed to Medicaid | 2.6% | 2.5% | 3.3% | 5.4% | 2.3% | 2.9% | 4.8% | 0.5% | 3.7% | |||||||||
Outpatient Treatment Services | ||||||||||||||||||
Psychotherapy | 4.9% | 5.8% | 5.4% | 7.8% | 4.0% | 5.7% | 8.2% | 1.1% | 6.1% | |||||||||
Case Management | 0.2% | 0.8% | 0.3% | 0.8% | 0.4% | 0.5% | 1.6% | 0.4% | 0.7% | |||||||||
Med Management | 0.3% | 1.7% | 1.5% | 2.1% | 0.8% | 2.0% | 1.5% | 0.1% | 1.4% | |||||||||
Skills Building (CBRS) | 0.2% | 1.3% | 0.6% | 1.9% | 0.4% | 0.9% | 1.9% | 0.4% | 1.1% | |||||||||
Targeted Care Coordination (TCC) | 0.1% | 0.8% | 0.5% | 1.4% | 0.3% | 0.8% | 1.3% | 0.1% | 0.8% | |||||||||
Support services | ||||||||||||||||||
Respite | 0.0% | 0.9% | 0.1% | 0.2% | 0.1% | 0.6% | 0.4% | 0.1% | 0.2% | |||||||||
Youth Support Services | 0.0% | 0.2% | 0.1% | 0.3% | 0.2% | 0.1% | 0.2% | 0.1% | 0.2% | |||||||||
Family Support | 0.0% | 0.0% | 0.0% | 0.0% | 0.0% | 0.1% | 0.4% | 0.0% | 0.1% | |||||||||
Interrelated Challenges
Interrelated challenges faced by the YES system, as well as opportunities to grow and improve YES, include the following:
- the ongoing mental health care workforce shortage
- lack of access to mental health care in rural/frontier areas of Idaho
- increased mental health care need
- the absence of high-intensity services.
View the full SFY 2024, 3rd Quarter QMIA Report
YES reports:
The following are links to the YES reports noted within the QMIA-Q and/or produced as part of YES Quality monitoring and review:
Biannual Estimate of Need for Intensive Care Coordination using Wraparound in Idaho, SFY 2024 (December 2023 report)
https://yes.idaho.gov/wp- content/uploads/2024/01/Estimated_Need_ICC_Wraparound_SFY_2024_Dec_2023.pdf
Final Report of the YES Quality Review (SFY 2022)
https://yes.idaho.gov/wp-content/uploads/2023/01/QR-Report_Final-Report_2022v2.pdf
Historical QMIA-Q reports
https://yes.idaho.gov/yes-quality-management-improvement-and-accountability/
Idaho YES Family Survey Results, 2023
https://yes.idaho.gov/wp-content/uploads/2023/08/2023YESFamilySurveyResults.pdf
Provider Survey of the Youth Empowerment Services Quality Review (FY2023-2024)
https://yes.idaho.gov/wp-content/uploads/2024/04/2023_QR-Report_01-Agency-Survey.pdf
Unmet Need for Mental Health Services among Idaho Youth, 2023
https://yes.idaho.gov/wp-content/uploads/2023/11/Unmet-Need-for-Mental-Health-Services-Among-Idaho- Youth-2023.pdf
YES Medicaid Outpatient Utilization, State Fiscal Years, 2020-2023
https://yes.idaho.gov/wp-content/uploads/2023/11/YES-QMIA-Quarterly-Report-Supplement-for-SFY2020- 2023-October-2023.pdf
Executive Summary – SFY 2024, Q2
The QMIA-Q report for State Fiscal Year (SFY) 2024, Quarter 2 (Q2) provides information about the delivery of YES services for October, November, and December 2023 and trends over the past five years of YES implementation. Modifications to the report format initiated in SFY 2023, Quarter 1, intended to make the data provided easier to understand and to facilitate comparisons between regions, have been maintained.
E1 YES Accomplishments
Increased Access to Intensive Home and Community-Based Services
As illustrated in the table and figure below, efforts by DBH and the Medicaid/Optum Network to increase the availability and use of Intensive Home and Community-Based Services (IHCBS) have been partially successful. The Optum/Medicaid Network data included in the table and figure represents unduplicated annual totals. The SFY 2024 total of 98 includes only the first two quarters of the year. If IHCBS service use continues at its current pace in the final two quarters of SFY 2024, the projected annual unduplicated total will be 196. This total is more than double the SFY 2023 total.
Intensive Home and Community Based Services | Region 1 | Region 2 | Region 3 | Region 4 | Region 5 | Region 6 | Region 7 | Total |
SFY 2022 Unduplicated Distinct Utilizers | 0 | 0 | 5 | 17 | 0 | 28 | 10 | 60 |
SFY 2023 Unduplicated Distinct Utilizers | 0 | 2 | 8 | 21 | 2 | 39 | 16 | 87 |
SFY 2024 Unduplicated Distinct Utilizers Year-to-Date (Q1-Q2) | 0 | 2 | 20 | 30 | 0 | 42 | 4 | 98 |
Opening of Psychiatric Residential Treatment Facility
Idaho’s first Psychiatric Residential Treatment Facility (PRTF), the Idaho Youth Ranch Residential Center for Healing and Resilience, opened in the southwestern area of the state in August 2023. Filling a gap in the YES system of care, the provision of in-state psychiatric residential treatment services for Idaho youth will keep those with complex mental health needs in-state and closer to their homes. The facility provides a safe, supportive, trauma-informed environment with treatment tailored to each youth and family. It includes a welcome center, therapy and wellness area, charter school, recreation center, library, kitchen/cafeteria, four residential lodges, and an equine center. The facility opened with five clients with plans to increase capacity to 64 beds during its first year of operations.
Two additional in-state PRFT facilities, Northwest Children’s Home and Jackson House, are still under construction. These facilities will add 48 beds and provide services to youths in the north and southeast regions of the state. Primary focus areas of each PRFT include serving male and female clients under eighteen, prioritizing children with Idaho Medicaid, and utilizing a trauma-informed model focusing on family involvement to include post-placement treatment and follow-up.
Expansion of Youth Crisis Services
Crisis services for Idaho youth expanded in 2023 and early 2024 with four Youth Crisis Centers (YCCs) opening. The YCCs provide support and services during the early stage of a mental health crisis before more intensive, costly, and restrictive interventions are required. The YBHCCs specialize in providing a calm environment for youth aged 12-17 to de-escalate, giving parents and guardians time to re-group during crisis situations. The centers are open 24/7, referrals are not needed, and Law Enforcement may bring youth to the YBHCCs. However, a parent or guardian must provide treatment consent. Services are 100% voluntary and free of charge, and youth can stabilize for up to 23 hours and 59 minutes.
YBHCC (opening date) | Location | SFY2024-Q1 Unduplicated (Duplicated) # served) | SFY2024-Q2 Unduplicated (Duplicated) # served) | Average Length of Stay | Insurance | # Referrals from Law Enforcement |
Rise up Teen and Child Crisis Center of East Idaho (June 15, 2023) | Idaho Falls | 28 (46) | 33 (55) | 16 hours | Medicaid (20) Private (8) | Unknown |
Proactive Youth and Family Support Center (Aug. 1, 2023) | Twin Falls | 23 (25) | 33 (40) | 14 hours | Medicaid (16) Private (2) Uninsured (4) Unknown (3) | 9 |
Pathways Youth Community Support Center (Oct. 16, 2023) | Boise | Not open during reporting period | 37 (46) | 13 hours | Unknown | Unknown |
Western Idaho Youth Support Center (Jan. 29, 2024) | Nampa | Not open during reporting period | Not open during reporting period | Not open during reporting period | Not open during reporting period | Not open during reporting period |
SFY 2023-2024 Quality Review Provider Survey Report Finalized
Idaho uses an annual Quality Review (QR) process to objectively assess and improve clinical practice and program effectiveness systemwide, identify program strengths and needs, develop actionable clinical data/information, and identify targeted areas for system improvement. Each year that purpose is applied to a central clinical question. This year’s QR process is focused on the need for a closer look at the process for engaging, high-quality care during the first 30 days of treatment. The two following questions were the focus of the Provider Survey portion of the QR:
- What change has there been in the provider network’s capacity for intensive community-based treatment?
- Do network providers perceive any changes in the state-level barriers and supports that impact the expansion of intensive community-based treatment?
Key findings of the Provider QR in terms of capacity for intensive community-based treatment include:
- The percentage of providers offering intensive community services plateaued this year after decreasing in the previous year;
- Despite recent rate increases for providers, there was not a corresponding increase in the desire to expand the breadth or intensity of services offered;
- Providers lack of trust in the Idaho Department of Health and Welfare (IDHW) continues to limit support for expanding the continuum of care.
The IDHW is actively addressing the recommended goal-directed actions outlined in the QR Provider Survey Report to grow the continuum of intensive support needed for Idaho’s children by investing in and supporting the provider network. Specifically:
- The new Idaho Behavioral Health Plan (IBHP) contractor, Magellan, is contractually required to lead provider engagement for the IBHP. However, IDHW also routinely interfaces with providers via Magellan provider forums and trainings, one on one meetings, and small group provider meetings across the State.
- Pilot testing of reimbursement mechanisms, including claims submission processes is explicitly required in the IBHP contract. User testing is targeted to begin in May 2024.
- The contract with Magellan outlines timelines and topics for specific live trainings by the Managed Care Organization (MCO). There are multiple training sessions every month, attendance and satisfaction survey information are shared with IDHW.
- Processes that are being used to minimize disruptions have been implemented and are communicated in training sessions as well as in other written materials.
Additional QR Provider Survey findings are detailed in Section 12 (Quality Monitoring), and by the end of April, the full report will be available on the YES website.
Annual Family Survey Updated with Stakeholder Involvement
The YES family survey is conducted annually to assess the quality and outcomes of mental health services for youth in Idaho’s YES system. The survey is mailed to a population-representative sample of 6,000 caregivers of youth who participated in mental health services during the prior year. Data collection for the 2024 YES family survey began in February and will conclude in mid-April 2024.
The 2024 family survey includes 11 new questions developed in conjunction with family members via a three-step process conducted by Boise State University (BSU), the YES family survey contractor. First, 15 elicitation interviews were conducted with family members. These interviews were designed to understand how families experience YES principles in action and included both good and bad examples. Second, from these interviews, 11 new survey questions were created. Third, and finally, BSU conducted ten cognitive interviews with family members, designed to check whether family members understood the survey items and directions in the intended ways. From these interviews, BSU made changes to the wording of the new items prior to including them in the 2024 YES family survey.
Findings associated with the new questions will be available in July 2024, when the Family Survey Report for SFY 2024 will be published.
E2 YES Challenges and Opportunities
System of Care Service Availability Regional Highlights
The chart on the following page demonstrates that improvement is still needed in access to care across the state and highlights regional variability in service availability within the YES system. Regional penetration rates for Medicaid members accessing YES outpatient services are generally highest in Regions 4 and 7. For example, penetration rates for seven outpatient services in Region 7 are higher than the statewide average, indicating that the YES system has been more highly developed in the Eastern portion of Idaho. Region 4 also has several Outpatient Services with higher-than-average penetration rates. However, the service rates are still lower than desired in all regions, with regions 1 and 5 showing the lowest rates. YES partners have undertaken work to improve access to care.
Selected Penetration Rate for Medicaid Members Accessing YES Outpatient Services by Region
SFY 2024, Q2 | Penetration Rate by Region | |||||||||
1 | 2 | 3 | 4 | 5 | 6 | 7 | OOS | Average | ||
Assessments | ||||||||||
CANS Billed to Medicaid | 2.3% | 2.0% | 3.2% | 4.8% | 2.2% | 2.8% | 4.5% | 0.3% | 3.4% | |
Outpatient Treatment Services | ||||||||||
Psychotherapy | 4.6% | 5.6% | 5.2% | 7.7% | 3.8% | 5.5% | 7.6% | 1.1% | 5.9% | |
Case Management | 0.2% | 0.6% | 0.3% | 0.6% | 0.4% | 0.5% | 1.4% | 0.3% | 0.6% | |
Med Management | 0.3% | 1.5% | 1.5% | 2.1% | 0.9% | 2.0% | 1.3% | 0.1% | 1.4% | |
Skills Building (CBRS) | 0.2% | 1.1% | 0.6% | 1.4% | 0.4% | 0.8% | 1.7% | 0.0% | 0.9% | |
Targeted Care Coordination (TCC) | 0.0% | 0.6% | 0.4% | 1.0% | 0.3% | 0.9% | 1.2% | 0.1% | 0.7% | |
Support services | ||||||||||
Respite | 0.0% | 0.9% | 0.1% | 0.2% | 0.1% | 0.5% | 0.5% | 0.0% | 0.2% | |
Youth Support Services | 0.0% | 0.3% | 0.1% | 0.2% | 0.2% | 0.1% | 0.2% | 0.1% | 0.2% | |
Family Support | 0.0% | 0.0% | 0.1% | 0.1% | 0.0% | 0.1% | 0.4% | 0.0% | 0.0% | |
Interrelated Challenges
Interrelated challenges faced by the YES system, as well as opportunities to grow and improve YES, include the following:
- the ongoing mental health care workforce shortage
- lack of access to mental health care in rural/frontier areas of Idaho
- increased mental health care need
- the absence of high-intensity services.
E3 Medicaid/Optum Network Outpatient Expenditure, Eligibility, and Utilization Trends Over Time
Expenditures for outpatient services provided by the Medicaid/Optum Network have increased substantially since the beginning of SFY 2020. This trend is evident when examining average expenditure data over time by both distinct eligible members and service utilizers. The bump in expenditures during the first two quarters of SFY 2024 is likely attributable, at least in part, to reimbursement rate increases that went into effect on July 1, 2023. The rate increases included 38 behavioral health services, with rates per service increasing 5% – 30%.
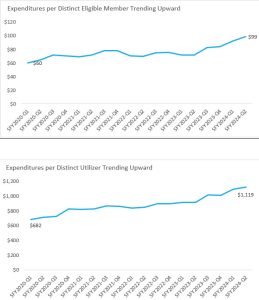
Statewide the number of youths eligible for Medicaid/Optum outpatient services and the number of youths utilizing services have dropped sharply since the latter half of SFY 2023. These declines are likely associated with the unwinding of Medicaid Protection, which was put in place at the beginning of the COVID-19 pandemic and provided Medicaid protection for individuals who might otherwise have been ineligible.
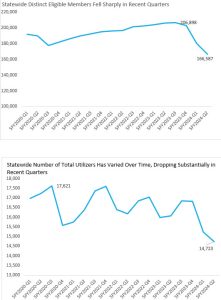
Although Medicaid/Optum outpatient services expenditures and numbers of eligible members/service users have varied substantially over time and especially in recent quarters, statewide utilization has remained consistent over time, varying from a low of 7.8% (SFY 2023-Q2) to a high of 9.9 (SFY 2020-Q3).
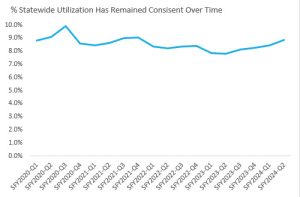
View the full SFY 2024, 2nd Quarter QMIA Report.
YES reports:
The following are links to the YES reports noted within the QMIA-Q and/or produced as part of YES Quality monitoring and review:
Biannual Estimate of Need for Intensive Care Coordination using Wraparound in Idaho, SFY 2024 (December 2023 report)
https://yes.idaho.gov/wp-content/uploads/2024/01/Estimated_Need_ICC_Wraparound_SFY_2024_Dec_2023.pdf
Final Report of the YES Quality Review (SFY 2022)
https://yes.idaho.gov/wp-content/uploads/2023/01/QR-Report_Final-Report_2022v2.pdf
Historical QMIA-Q reports
https://yes.idaho.gov/yes-quality-management-improvement-and-accountability/
Idaho YES Family Survey Results, 2023
https://yes.idaho.gov/wp-content/uploads/2023/08/2023YESFamilySurveyResults.pdf
Unmet Need for Mental Health Services among Idaho Youth, 2023
YES Medicaid Outpatient Utilization, State Fiscal Years, 2020-2023
Executive Summary – SFY 2024, Q1
The QMIA-Q report for State Fiscal Year (SFY) 2024, Quarter 1 (Q1) provides information about the delivery of YES services for July, August, and September 2023 and trends over the past five years of YES implementation. Modifications to the report format initiated in SFY 2023, Quarter 1, intended to make the data provided easier to understand and to facilitate comparisons between regions, have been maintained.
E1 YES Accomplishments
Medicaid/Optum Network Average Expenditure Per Member Has Increased in All Regions
Average expenditure per eligible member increased for all regions between SFY22-Q4 and SFY24-Q1. However, the rate of increase varied substantially across regions, with major increases in Regions 1, 2, and 4 and lesser increases in other regions between the two time periods. DBH is working with IBHP personnel to understand the changes in expenditures. Explanatory information will be provided in future QMIA Quarterly reports.
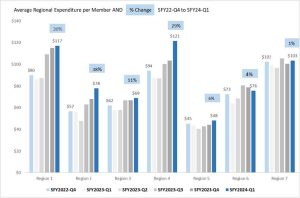
Expansion of Youth Crisis Services
Crisis services for Idaho youth expanded in 2023 with three Youth Behavioral Community Crisis Centers (YBHCCs) opening. The YBHCCs provide supports and services during the early stage of a mental health crisis before more intensive, costly, and restrictive interventions are required. The YBHCCs specialize in providing a calm environment for youth aged 12-17 to de-escalate, giving parents and guardians time to re-group during crisis situations. The centers are open 24/7, referrals are not needed, and Law Enforcement may bring youth to the YBHCCs. However, a parent or guardian must provide treatment consent. Services are 100% voluntary and free of charge, and youth can stabilize for up to 23 hours and59 minutes.
YBHCCs serve the communities of Idaho Falls, Twin Falls, and Boise. Another YBHCC is scheduled to open in Nampa in January 2024.
YBHCC (opening date) | Location | Unduplicated # (Duplicated #) of youth served – SFY2024-Q1 | Average Length of Stay | Insurance | # Referrals from Law Enforcement |
Rise up Teen and Child Crisis Center of East Idaho (June 15, 2023) | Idaho Falls | 15 (46) | 16.16 hours | Medicaid (20) Private (8) | Unknown |
Proactive Youth and Family Support Center (August 1, 2023) | Twin Falls | 23 (25) | 12.75 hours | Medicaid (16) Private (2) Uninsured (4) Unknown (3) | 9 |
Pathways Youth Community Support Center (October 16, 2023) | Boise | Facility was not open during reporting period | |||
E2 YES Challenges and Opportunities
System of Care Service Availability Regional Highlights
The chart on the following page demonstrates that improvement is still needed in access to care across the state and highlights regional variability in service availability within the YES System of Care. Regional penetration rates for Medicaid members accessing YES outpatient services are generally highest in Regions 4 and 7. For example, penetration rates for seven outpatient services in Region 7 are higher than the statewide average, indicating that the YES system of care has been more highly developed in the Eastern portion of Idaho. Region 4 also has several Outpatient Services with higher-than-average penetration rates. However, the rates of service are still lower than desired in all regions, with regions 1 and 5 showing the lowest rates. Work to improve access to care has been undertaken by YES partners.
Selected Penetration Rate for Medicaid Members Accessing YES Outpatient Services by Region
SFY 2024, Q1 | Penetration Rate by Region | |||||||||
1 | 2 | 3 | 4 | 5 | 6 | 7 | OOS | Average | ||
Assessments | ||||||||||
CANS Billed to Medicaid | 1.9% | 1.9% | 3.1% | 4.6% | 2.2% | 2.6% | 4.3% | 0.2% | 3.2% | |
Outpatient Treatment Services | ||||||||||
Psychotherapy | 4.2% | 5.2% | 5.0% | 7.1% | 3.6% | 5.1% | 7.2% | 0.9% | 5.5% | |
Case Management | 0.2% | 0.8% | 0.3% | 0.7% | 0.4% | 0.4% | 1.4% | 0.1% | 0.6% | |
Med Management | 0.3% | 1.4% | 1.5% | 1.9% | 0.9% | 1.7% | 1.1% | 0.2% | 1.3% | |
Skills Building (CBRS) | 0.2% | 1.1% | 0.6% | 1.3% | 0.3% | 0.8% | 1.8% | 0.2% | 0.9% | |
Targeted Care Coordination (TCC) | 0.0% | 0.4% | 0.4% | 0.8% | 0.3% | 0.8% | 1.2% | 0.1% | 0.6% | |
Support services | ||||||||||
Respite | 0.0% | 0.9% | 0.2% | 0.2% | 0.0% | 0.4% | 0.4% | 0.0% | 0.2% | |
Youth Support Services | 0.0% | 0.2% | 0.1% | 0.3% | 0.2% | 0.1% | 0.2% | 0.0% | 0.2% | |
Family Support | 0.0% | 0.0% | 0.1% | 0.1% | 0.0% | 0.1% | 0.4% | 0.0% | 0.1% | |
Interrelated Challenges
Interrelated challenges faced by the YES system of care, as well as opportunities to grow and improve YES, include the following:
- the ongoing mental health care workforce shortage
- lack of access to mental health care in rural/frontier areas of Idaho
- increased mental health care need
- the dearth of high-intensity services
YES reports:
The following are links to the YES reports noted within the QMIA-Q and/or produced as part of YES Quality monitoring and review:
Biannual Estimate of Need for Intensive Care Coordination using Wraparound in Idaho, SFY 2024 (December 2023 report)
https://yes.idaho.gov/wp-content/uploads/2024/01/Estimated_Need_ICC_Wraparound_SFY_2024_Dec_2023.pdf
Final Report of the YES Quality Review (SFY 2022)
https://yes.idaho.gov/wp-content/uploads/2023/01/QR-Report_Final-Report_2022v2.pdf
Historical QMIA-Q reports
https://yes.idaho.gov/yes-quality-management-improvement-and-accountability/
Idaho YES Family Survey Results, 2023
https://yes.idaho.gov/wp-content/uploads/2023/08/2023YESFamilySurveyResults.pdf
Provider Survey of the YES Quality Review, FY 2021-2022
https://yes.idaho.gov/wp-content/uploads/2022/10/QRReport01AgencySurvey2022.pdf
Unmet Need for Mental Health Services among Idaho Youth, 2023
YES Medicaid Outpatient Utilization, State Fiscal Years, 2020-2023
Executive Summary – SFY 2026, Q3
To view full QMIA-Q Report, click here.
The QMIA-Q report for State Fiscal Year (SFY) 2026, Quarter 3 (Q3) provides information about the delivery of YES
services for January, February, and March 2026. Where comparable data is available, the report also examines trends
across the past five years of YES implementation. The report continues to undergo substantial revision as new data from
Magellan replaces data that was previously provided by Optum, Medicaid, and DBH.
YES Accomplishments and Updates
Current and Planned Report Enhancements
Current Reporting Period Changes and Enhancements
In response to feedback regarding data clarity and reporting consistency, several enhancements to the QMIA-Q have
been implemented during this reporting period:
- Distinct Utilizer Annual Statewide Metrics Provided: Section 2 now presents statewide annual distinct utilizer counts and utilization rates for YES services and supports across a five-year period (SFY 2022 – SFY 2026-Q3) in sub-sections 2c through 2g. This framework utilizes a 12-month rolling average for each current period. For example, data for SFY 2026-Q3 reflect a 12-month span from April 2025 through March 2026. This methodology will be maintained in future quarterly updates to better facilitate the identification of long-term utilization trends and patterns. As the QMIA-Q report is further refined, traditional reporting of discrete three-month
quarterly counts may be phased out. However, to ensure near-term reporting continuity, SFY 2026-Q3 counts for all YES services and supports remain available in Appendix C. - IBHP Claims Payment Reporting Period Modified: Claims payment data will be reported using a 12-month rolling average (April 2025 – March 2026 for SFY 2026-Q3) rather by quarter-specific claims payment. This transition to a 12-month rolling average aligns with the updated annual services and supports reporting framework and will facilitate annual expenditure comparisons over time.
- Standardized Terminology: The terms penetration and utilization have been updated to align with standard
conventions to promote clearer communication. - Enhanced Data Transparency: To eliminate potential confusion from summarized data distributions, we have replaced summarized data distributions (e.g., averages and distribution low and high points) with tables and figures that include all raw data points. Concurrently, rate and percentage calculations have been largely omitted to prevent misinterpretation.
- New Intensive Care Coordination (ICC) Section: A dedicated data section has been introduced, featuring detailed SFY 2025 data for Magellan ICC and Wraparound services.
Executive Summary – SFY 2023, Q4
The QMIA-Q report for State Fiscal Year (SFY) 2023, Quarter 4 (Q4) provides information about the delivery of YES services for April, May, and June, 2023, and trends over the past five years of YES implementation. Modifications to the report format initiated in SFY 2023, Quarter 1, intended to make the data provided easier to understand and to facilitate comparisons between regions, have been maintained. The report also now includes annualized statewide outpatient service utilization data from state fiscal years 2020,2021, 2022, and 2023 (see Table 5c). Additionally, a supplemental report with annualized regional outpatient service utilization data for fiscal years 2020 through 2023 is also available on the YES website.
E1 YES Accomplishments
During SFY 2023, significant progress was made in fulfilling the requirements of Jeff D. Settlement Agreement Implementation Assurance Plan (IAP). First, a final draft of the much-anticipated YES Services & Supports Crosswalk was submitted. The exhaustive crosswalk matrix describes the scope and parameters (e.g., authorization requirements; service timelines) of the medically necessary services and supports that should be provided to YES-eligible youth based on their individual strengths and needs. While this final draft version will require minor updating to become the final services and supports document, it represents an important achievement for the YES system of care. A second accomplishment in 2023 was the provision of the draft Access Pathways Maps to the Implementation Work Group (IWG). At present the IWG is consulting with the DBH to finalize the maps. In addition to the strides made in satisfying IAP requirements, there was continued reduction of 20-511a Court Orders[1] in SFY 2023. The annual volume of 20-511a Court Orders has been reduced by more than 50% since 2016.
Historical annualized Number of Court Ordered 20-511a, SFY 2015 to 2023
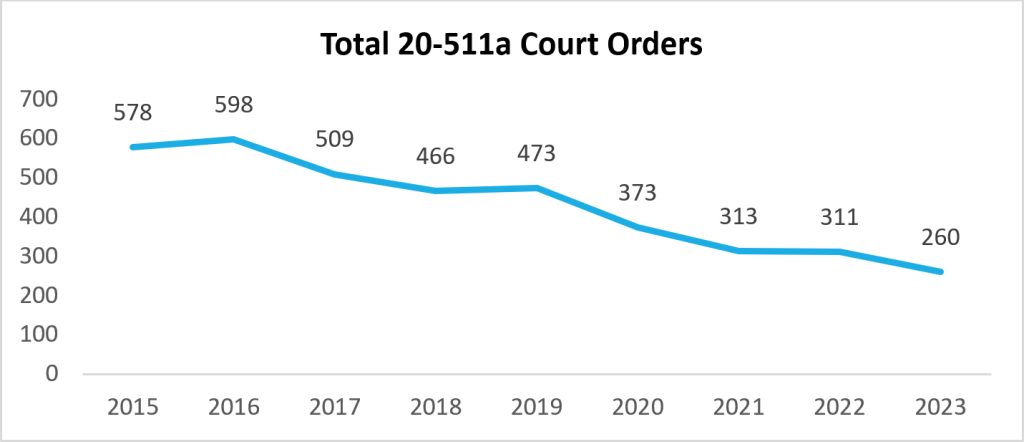
[1] 20-511a – Reference to Idaho Statute 20-5011A (Mental Health Assessment and Plan of Treatment). This statute provides authority for a judge to order a mental health assessment of youth and convene a screening team to evaluate the plan of treatment and make recommendations to the court.
Finally, substantial resources have been committed to facilities and services that will provide critical support to Idaho youth, particularly those experiencing behavioral health crises, including new Psychiatric Residential Treatment Facilities (PRFT), Youth Behavioral Health Community Crisis Centers, Youth Assessment Centers, and a 988 Hotline and Mobile Crisis Response Team.
E2 2023 YES Family Survey Highlights
The YES Family Survey is conducted annually to assess the quality and outcomes of mental health services for youth in Idaho’s YES system of care from the perspective of families and to highlight areas for statewide service improvement efforts. Key 2023 survey findings include:
- Youth outcomes were better when caregivers rated their family’s mental health services higher on YES principles (e.g., family-centered and strengths-based).
- Between 2021 and 2022, the percentage of youth who received a face-to-face visit during a mental health crisis increased from 15% to 36%. This gain was largely maintained in 2023 – 33% of caregivers indicated their child had received a crisis visit.
- Reflective of the current strain on mental health resources, including the substantial mental health provider workforce shortage, family ratings declined on 13 of 19 items designed to assess the extent to which the services received by youth and families reflect YES principles. Items that declined reflected youth involvement in service planning, the availability of services recommended by providers, and coordination of services across providers.
The full 2023 YES Family Survey Results report is available on the YES Website at the following link: https://yes.idaho.gov/wp-content/uploads/2023/08/2023YESFamilySurveyResults.pdf
E3 Assessing the Need for Intensive Care Coordination
Meeting the needs of Idaho youth who experience serious emotional disturbance continues to challenge the YES system of care. An important component of YES is the delivery of Intensive Care Coordination (ICC) using high-quality Wraparound. The Wraparound method for delivering ICC is designed to support youth with complex and intensive mental health needs so they can remain in their communities. Representing an increase of 12.6% since 2016, the June 2023 biannual estimate of need for ICC among Idaho Youth indicated 1,520 Idaho youth would have been benefited from participating in ICC using high quality Wrapround in 2023. During the same period there was an 9.6% increase in Idaho’s population of youth under the age of 18; this indicates that the need for ICC is outpacing population growth. However, just 107 Idaho youth received Wraparound services in FY 2023. Thus, approximately 93% of youth who may have needed Wraparound did not receive those intensive services.
The full 2023 Intensive Care Coordination Need report is available on the YES Website at the following link: https://yes.idaho.gov/wp-content/uploads/2023/06/Estimated-Need-ICCReportJuly2023.pdf
E4 YES Challenges and Opportunities
Interrelated challenges faced by the YES system of care as well as opportunities to grow and improve YES include the following: the ongoing mental health care workforce shortage, lack of access to mental health care in rural/frontier areas of Idaho, increased mental health care need, the dearth of high intensity services (as illustrated in part by the tables below), and providers struggling with reimbursement rates that are not keeping pace with the costs of doing business, connected in part to the administrative burden associated with providing Medicaid services.
The following tables highlight the limited availability of Intensive Outpatient Treatment Services for Medicaid members under the age of 18 across all regions of the state. The first table provides an overview of the number served, while penetration rates (number receiving services/number of Medicaid members) are provided in the second table.
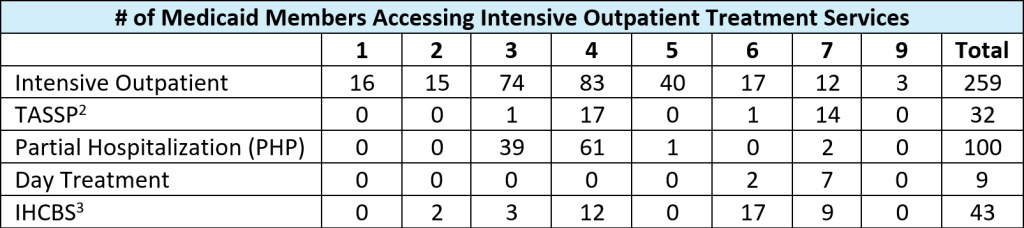
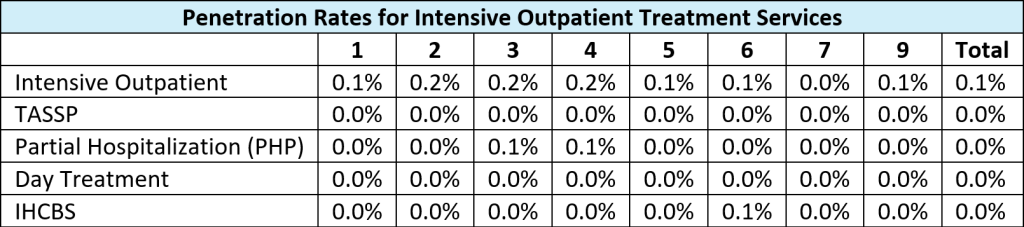
[2] TASSP- Therapeutic After School Support Program
[3] IHCBS – Intensive Home and Community Based Services
There also remains considerable opportunity for YES partners to work in a more coordinated fashion to share data as well as to synchronize services for youth in the YES system of care.
YES reports:
The following are links to the YES reports noted within the QMIA-Q:
Biannual Estimate of Need for Intensive Care Coordination, SFY 2023 (June 2023 report): https://yes.idaho.gov/wp-content/uploads/2023/06/Estimated-Need-ICCReportJuly2023.pdf
Final Report of the YES Quality Review (SFY 2022): https://yes.idaho.gov/wp-content/uploads/2023/08/2023YESFamilySurveyResults.pdf
Historical QMIA-Q reports: https://yes.idaho.gov/yes-quality-management-improvement-and-accountability/
Idaho YES Family Survey Results, 2023: https://yes.idaho.gov/wp-content/uploads/2023/08/2023YESFamilySurveyResults.pdf
Provider Survey of the YES Quality Review, FY 2021-2022: https://yes.idaho.gov/wp-content/uploads/2022/10/QRReport01AgencySurvey2022.pdf
Review the full SFY 2023 Quarter 4 QMIA report here.
Review the YES QMIA Quarterly Supplement for SFY2020-2023 – October 2023 report here.
Executive Summary – Q3 SFY 2023
The QMIA-Q report for State Fiscal Year (SFY) 2023, Quarter 3 (Q3) provides information about the delivery of YES services for January, February, March, 2023, and trends over the past five years of YES implementation.
Changes to the report format initiated in SFY 2023, Quarter 1, intended to make the data provided more useful and easier to understand, have been intained. The significant changes are in Section 5 of the report on Medicaid Outpatient services. Information has been added to the statewide portion of the section. The statewide information now includes both a table with all services with number of youths serviced and a table with the penetration rates of all services. Data about services (i.e., Case Management, Therapeutic After School [TASSP], Crisis Services, and Family Support Partners) that had not previously been reported is also included.
In this same section of the QMIA-Q report (Section 5), a switch has been made from reporting service utilization by service type to reporting on all services by region. For example, Region 1 has all the YES services in Region 1, Region 2 has all the YES services in Region 2, etcetera. All the previously available data about services remains, but by breaking out the utilization data for each service by region, the QMIA-Q provides a clearer picture of how service utilization varies across the state. In addition, reports provided for each region include the number of youths served, the percent of the type of services used by those accessing services, and the penetration rate. This change standardizes the information for each region and provides a basis for comparing each region to the statewide results.
Data for QMIA-Q Q3 includes the updated Estimation of YES Eligibility (E1), statewide access to YES Outpatient Medicaid services (E2), the average Medicaid expenditure per member served by region (E3), access to intensive outpatient Medicaid services (E4), updates on quality improvement projects, and a list of published YES reports.
E1: Annual YES Eligibility Estimation SFY 2023 – updated in Dec 2022
| Type of Insurance | |||||
| Employer | Non-Group | Medicaid | Uninsured | Total | |
| Insured rate based on 2020 Estimated Census | 50.70% | 5% | 34.90% | 7.10% | NA |
| Population | 246,000 | 25,000 | 170,000 | 35,000 | NA |
| Estimated prevalence | 6% | 6% | 8% | 12% | NA |
| Estimated need | 14,760 | 1,500 | 13,600 | 4,165 | NA |
| Expected Utilization Lower Estimate 15% | 2215 | 225 | 13,600 | 4,165 | 20,205 |
| Expected Utilization Higher Estimated 18% | 2655 | 270 | 13,600 | 4,165 | 20,690 |
E2: Statewide access to YES Outpatient Medicaid Services
One aspect of identifying regional service gaps is understanding access statewide. As the chart below indicates, the number of Medicaid members under the age of 18 receiving outpatient services has varied over the last 18 quarters, with the highest number being 18,105 in Quarter 4 of SFY 2019 and the lowest number of 15,347 in Quarter 2 of SFY 2023. The overall trend is decreasing (blue dotted line), although the numbers served increased in the most in the current quarter (Q3-SFY2023). An analysis of the past quarters indicates that the average number of children and youth receiving services per quarter is approximately 16,631 (black line), and for the most recent seven quarters, the number accessing services has been trending below the average.

E3: Average Medicaid Outpatient Expenditure Per Distinct User by Region
An analysis of Medicaid outpatient expenditure in SFY 2023, Q3 by region indicates there continues to be substantial variation in expenditures across the state – from $40 per person served in Region 5 to $106 per person served in Region 1.

E4: Access to Intensive Outpatient Medicaid Services by Type and Region
The following tables highlight the limited availability of Intensive Outpatient Treatment Services for Medicaid members under the age of 18 across all regions of the state. The first table provides an overview of the number served, while penetration rates (number receiving services/number of Medicaid members) are provided in the second table.

E5: Quality Improvement Projects (QIPs)
Crisis and Safety Plans
To help families with the need for higher quality, effective Crisis and Safety Plans, the Division of Behavioral Health implemented a QIP. In SFY 2021, standardized forms for crisis and safety planning, and other helpful information related to a crisis were added to the YES website. In addition, a collaborative workgroup of parents and youth, the Idaho Department of Health and Welfare Divisions of Behavioral Health and Family and Community Services, the Idaho Department of Juvenile Corrections, and the State Department of Education created a video for youth and parents about how to create an effective crisis and safety plan. The video is available in English and Spanish on YouTube, via a link from the YES website (yes.idaho.gov).
Crisis and Safety Plan training was provided to community providers in the fall of 2022 based on recommendations from family representatives on the Family Advisory Subcommittee (Q-FAS). The creation and use of effective safety planning training was provided in five total sessions. Attendance at the training was very good with over 500 participants. Although the 2022 family survey4 did not indicate there had been a substantial improvement in the percentage of caregivers who indicated a provider had helped them make a crisis and safety plan (60% in 2021, 61% in 2022) or in percentage of caregivers who perceived the plan would be effective in an actual crisis (61% in 2021 and 2022), the training session took place late in fiscal year so it is plausible a greater impact will be observed in the 2023 family survey.
The ongoing QIP effort also includes a second set of Crisis and Safety Planning trainings offered to providers in the summer of 2023. Three sessions will be available to providers in this round of training. Additional details about these trainings will be provided in future QMIA-Q reports and Family Survey data will continue to be used to assess whether providers are helping youth and families create crisis and safety plans as well as caregiver perceptions of the effectiveness of their individual plans.
Hospital Discharge Standard
Over the past several years, there have been complaints related to children/youth being discharged home without families having input on the discharge plan. During SFY 2022, a small workgroup (DBH Quality staff and Family Members from the Council) began research into the development of a hospital discharge standard. The workgroup’s goal was to draft a standard based on policies, guidelines for best practices, and rules in other states in order to propose a new standard be adopted by Idaho and used by Idaho’s community hospitals. This team felt that “Transitions of Care” would be a more appropriate name for this standard as there are times individuals require a higher level of care. A draft of this Behavioral Health Transitions of Care standard was forwarded to the DBH Policy Unit for review on June 27, 2022. The proposed standard has not yet been adopted.
YES reports
The following are links to the YES reports noted within the QMIA Q
Provider Survey of the YES Quality Review, FY 2021-2022: https://yes.idaho.gov/youth-empowerment-services/about-yes/yes-history/?target=8
QMIA-Q historical reports: https://yes.idaho.gov/yes-quality-management-improvement-and-accountability/
YES Family Survey Results: https://yes.idaho.gov/youth-empowerment-services/about-yes/yes-history/?target=8
YES Quality Review SFY 2022 Final Report: https://yes.idaho.gov/youth-empowerment-services/about-yes/yes-history/?target=8
YES Rights and Resolutions: https://yes.idaho.gov/yes-quality-management-improvement-and-accountability/, click on “Additional QMIA Data and Reports” and scroll down the page
Executive Summary – Q2 SFY 2023
The QMIA-Q report for SFY 2023, Quarter 2 (Q2) provides information about the delivery of YES services for October, November, December 2022, and trends over the past five years of YES implementation.
There have been some changes in the format which are intended to make the data that is provided more useful and easier to understand. The major changes are in Section 5 of the report on Medicaid Outpatient services. First, new information has been added to the statewide portion of the section. The statewide information now includes both a table with all services with number of youth serviced and a table with the penetration rates of all services. There is now data about services that had not previously been reported including: Case Management, Therapeutic After School (TASSP), Crisis Services, and Family Support Partners.
In this same section of the QMIA-Q report (Section 5), a switch has been made from reporting service utilization by service type to reporting on all services by region. For example, Region 1 has all the YES services in Region 1, Region 2 has all the YES services in Region 2, etc. All of the previously-available data about services remains, but by breaking out the utilization data for each service by region the QMIA-Q provides a clearer picture of how service utilization varies across the state. In addition, reports are provided for each region with the number of youth served, the percent of the type of services that were used by those accessing services, and the penetration rate. This change standardizes the information for each region and provides a basis for comparing each region to the statewide results.
Data for QMIA-Q Q2 includes the updated Estimation of YES Eligibility (E1) and also for Wraparound, statewide access to YES Outpatient Medicaid services (E2), the average Medicaid expenditure per member served by region (E3), access to intensive outpatient Medicaid services (E4), updates on quality improvement projects, and a list of the YES reports that have been published.
E1 Annual YES Eligibility Estimation SFY 2023- updated in Dec 2022
Type of insurance | |||||
Employer | Non-Group | Medicaid | Uninsured | Total | |
Insured rate based on 2020 Estimated Census | 50.70% | 5% | 34.90% | 7.10% | |
Population | 246,000 | 25,000 | 170,000 | 35,000 | |
Estimated prevalence | 6% | 6% | 8% | 12% | |
Estimated need | 14,760 | 1,500 | 13,600 | 4,165 | |
Expected Utilization Lower Estimate 15% | 2215 | 225 | 13,600 | 4,165 | 20,205 |
Expected Utilization Higher Estimate 18% | 2655 | 270 | 13,600 | 4,165 | 20,690 |
In addition to the annual estimate of YES eligibility, BSU completed an updated estimate of the need for Wraparound Intensive Services (WInS), also called “Wraparound”. Below is the Executive Summary of the report.
Executive Summary
Objective: The State of Idaho Youth Empowerment Services (YES) program aims to develop, implement, and sustain a youth- and family-driven, coordinated, and comprehensive system-of-care that meets the mental health needs of Idaho youth who experience a serious emotional disturbance. One important component of YES is the delivery of Intensive Care Coordination (ICC) that uses high-quality Wraparound. The Wraparound model is a specific method for delivering ICC that incorporates system-of-care values, well specified procedures, and standardized quality monitoring. ICC using high-quality Wraparound is designed to support youth with the most complex and intensive mental health needs so they can remain in the community rather than being placed outside their home. In order to monitor the State’s progress toward meeting the needs of this population, the Idaho Department of Health and Welfare, Division of Behavioral Health contracted with Boise State University in 2022 to develop biannual estimates of the need for ICC among Idaho youth. The purpose of this report is to project the initial estimate of need for ICC among Idaho youth for State Fiscal Year (SFY) 2023.
Method: Using two methodologies developed in prior work, two projections were generated of the number of Idaho youth who are likely to need ICC in SFY 2023. The first methodology used a predictive analytic model developed through an analysis of ICC utilization data from 11 States and the incorporation of Idaho population characteristics. The second methodology analyzed aggregate Idaho administrative data on publicly-funded, out-of-home and inpatient mental health services for youth in Quarter 1 of SFY 2023.
Results: Application of the predictive analytic model resulted in an estimate of 1,521 Idaho youth who are likely to need ICC in SFY 2023. Analysis of Idaho service utilization data yielded an estimate of 1,642 Idaho youth who are likely to need ICC in SFY 2023. The relative proximity of the two estimates, derived through different methodologies, increases confidence in their potential utility. In combination, these methodologies suggest 1,582 Idaho youth will need ICC using high-quality Wraparound in SFY 2023.
Conclusions and Recommendations: In SFY 2023, it is estimated that 1,582 Idaho youth will need ICC using high-quality Wraparound. Reflecting the growth and change in Idaho’s population, this represents a 17% increase in need for ICC compared to an estimate from SFY 2016. The estimates presented here will be updated as newer data become available. These estimates provide benchmarks for monitoring Idaho’s progress toward meeting the needs of youths with intensive mental health needs.
March 3, 2023
The entire report can be found on the YES Website at the following link: https://yes.idaho.gov/youth-empowerment-services/about-yes/yes-history/?target=8
E2: Statewide access to YES Outpatient Medicaid Services
A Quality Improvement Project (QIP) to address the need for service availability across all 7 regions has been implemented. The first step of the QIP is to identify the gaps in services.
One aspect of identifying the gaps is to analyze access statewide. As the chart below indicates the number of Medicaid members under the age of 18 that received outpatient services has varied over the last 18 quarters with the highest number being 18,105 in April – June 2019, and the lowest number of 15,347 in Oct- Dec 2022. The overall trend is decreasing (blue dotted line), although the numbers served did increase in 2022. An analysis of the past quarters indicates that the average number of children and youth receiving services per quarter is approximately 16,655 (black line) and for the most recent 6 quarters the number accessing services has been trending below the average.
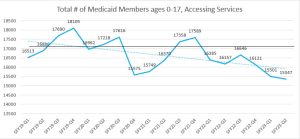
E3 Average Medicaid Outpatient Expenditure Per Distinct User by Region
An analysis of Medicaid outpatient expenditure in SFY Q2 by region indicates that there continues to be substantial variation in expenditures across the state – from $89 per person served in Region 7 to $37 per person served in Region 5.
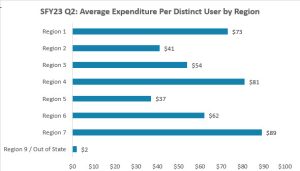
E4 Access to Intensive Outpatient Medicaid Services by Type and Region
The following tables show the number serviced and the penetration rate (number receiving services/number of Medicaid members) for outpatient services provided to Medicaid members under the age of 18, with rates noted by type of service and by the region in which the service was delivered.
# of Medicaid Members Accessing Intensive Outpatient Treatment Services | |||||||||
1 | 2 | 3 | 4 | 5 | 6 | 7 | 9 | Total | |
Intensive Outpatient | 18 | 4 | 50 | 77 | 32 | 12 | 10 | 1 | 203 |
TASSP[1] | 0 | 0 | 0 | 0 | 0 | 0 | 5 | 0 | 5 |
Partial Hospitalization (PHP) | 1 | 0 | 37 | 56 | 3 | 1 | 9 | 0 | 105 |
Day Treatment | 0 | 0 | 0 | 3 | 14 | 0 | 8 | 0 | 24 |
IHCBS[2] | 0 | 0 | 1 | 8 | 2 | 14 | 6 | 0 | 30 |
Penetration Rates for Intensive Outpatient Treatment Services | |||||||||
1 | 2 | 3 | 4 | 5 | 6 | 7 | 9 | Total | |
Intensive Outpatient | 0.1% | 0.0% | 0.1% | 0.2% | 0.1% | 0.1% | 0.0% | 0.0% | 0.1% |
TASSP | 0.0% | 0.0% | 0.0% | 0.0% | 0.0% | 0.0% | 0.0% | 0.0% | 0.0% |
Partial Hospitalization (PHP) | 0.0% | 0.0% | 0.1% | 0.1% | 0.0% | 0.0% | 0.0% | 0.0% | 0.05% |
Day Treatment | 0.0% | 0.0% | 0.0% | 0.0% | 0.0% | 0.0% | 0.0% | 0.0% | 0.0% |
IHCBS | 0.0% | 0.0% | 0.0% | 0.0% | 0.0% | 0.1% | 0.0% | 0.0% | 0.0% |
[1] TASSP- Therapeutic After School Support Program
[2] IHCBS – Intensive Home and Community Based Services
Based on data about access to services and on-going concerns from families and advocacy groups, the QMIA Council recommended to the YES Sponsors and Defendants Workgroup (DWG) that a QIP be implemented for services needed specifically for children and youth with complex/high needs.
Short term goals for the QIP are to define the population, identify missing and needed services, identify the reason why services are not available and research interventions used in other states that have been successful in responding to this issue.
E5 Quality Improvement Projects (QIPs)
Crisis and Safety Plans
To help families with the need for higher quality, effective Crisis and Safety Plans, the Division of Behavioral Health implemented a QIP.
In state fiscal year (SFY) 2021, standardized forms for crisis and safety planning, and other helpful information related to a crisis, were added to the Youth Empowerment Services (YES) website. In addition, a collaborative workgroup of parents and youth, the IDHW Divisions of Behavioral Health and Family and Community Services, and the Idaho Department of Juvenile Corrections, and State Department of Education created a video for youth and parents about how to create an effective crisis and safety plan. The video is available in English and Spanish on YouTube and the YES website (yes.idaho.gov).
In SFY 2022, training for community providers on the creation and use of effective safety planning was provided in five total sessions. Attendance at the training was very good with over 500 participants. Based on the 2022 family survey[3], there has not yet been an improvement in the effectiveness of crisis safety plans (still at 60%), however the training took place later in the fiscal year (FY), so it is possible that there will be more of an impact that can be evaluated in SFY 2023.
The Crisis and Safety plan training provided in the fall of 2022, was based on recommendations from family representatives on the Family Advisory Subcommittee (Q-FAS), families gave input on the training and participated in the fall training. We will continue to collect data about the issue of Crisis and Safety Plans through the survey sent to families each spring.
Hospital Discharge Standard
Over the past several years, there have been complaints related to children/youth being discharged home without families having input on the discharge plan. During SFY 2022, a small workgroup (DBH Quality staff and Family Members from the Council) began research into the development of a hospital discharge standard. The workgroup’s goal was to draft a standard based on policies, guidelines for best practices and rules in other states in order to propose a new standard be adopted by Idaho and used by Idaho’s’ community hospitals. This team felt that “Transitions of Care” would be a more appropriate name for this standard as there are times in which individuals require a higher level of care. A draft of this Behavioral Health Transitions of Care standard was forwarded to the DBH Policy Unit for review on June 27, 2022. The proposed standard has not yet been adopted.
[3] A YES Family Survey is conducted annually to assess the YES Principles of Care
YES reports:
The following are links to the YES reports noted within the QMIA-Q
QMIA-Q historical reports: https://yes.idaho.gov/yes-quality-management-improvement-and-accountability/
YES Rights and Resolutions: https://yes.idaho.gov/yes-quality-management-improvement-and-accountability/, click on “Additional QMIA Data and Reports” and scroll down the page
Quality Review (QR): Provider Survey; https://yes.idaho.gov/youth-empowerment-services/about-yes/yes-history/?target=8
YES Family Survey Results : https://yes.idaho.gov/youth-empowerment-services/about-yes/yes-history/?target=8
Executive Summary – Q1 SFY 2023
The QMIA-Q report for SFY 2023, Q1 provides information about the delivery of YES services for July, August, September 2022, and trends over the past five years of YES implementation. There have been some changes in the format for the QMIA-Q for Q1 which are intended to make the data that is provided more useful and easier to understand.
The major changes are in Section 5 of the report on Medicaid Outpatient services. First, we have added new information into the statewide portion of this section. The statewide information now includes both a table with all services with number of youth serviced and a table with penetration rates of all services. There is also new data about services that had not previously been reported including: Case Management, Therapeutic After School (TASSP), Crisis Services, and Family Support Partners. In this portion of the report there is a new analysis that includes a statewide comparison of 5 specific targeted services: Psychotherapy, Case Management, Community Based Rehabilitation (CBRS), Targeted Care Coordination (TCC) and Intensive Home and community Based Services (IHCBS).
In this same section of the QMIA-Q report (Section 5), a switch has been made from reporting service utilization by service type to reporting on all services by region. For example, Region 1 has all the YES services in Region 1, Region 2 has all the YES services in Region 2, etc. All of the previously-available data about services will remains, but by breaking out the data about utilization of service by region the QMIA-Q provides a clearer picture of how service utilization varies across the state. In addition, reports are provided for each region with the number of youth served, the percent of the type of services that were used by those accessing services, and the penetration rate. This change standardizes the information for each region and provides a basis for comparing each region to the statewide results.
Data for QMIA-Q Q1 includes the updated Estimation of YES Eligibility (E1), statewide access to YES Outpatient Medicaid services (E2), average Medicaid expenditure per member served by region (E3), access to intensive outpatient Medicaid services (E4), updates on quality improvement projects, and a list of the YES reports that have been published.
E1 Annual YES Eligibility Estimation, updated for Dec 2022
Type of insurance | |||||
Employer | Non-Group | Medicaid | Uninsured | Total | |
Insured rate based on 2020 Estimated Census | 50.70% | 5% | 34.90% | 7.10% | |
Population | 246,000 | 25,000 | 170,000 | 35,000 | |
Estimated prevalence | 6% | 6% | 8% | 12% | |
Estimated need | 14,760 | 1,500 | 13,600 | 4,165 | |
Expected Utilization Lower Estimate 15% | 2215 | 225 | 13,600 | 4,165 | 20,205 |
Expected Utilization Higher Estimate 18% | 2655 | 270 | 13,600 | 4,165 | 20,690 |
E2: Statewide access to YES Outpatient Medicaid Services
A Quality Improvement Project (QIP) to address the need for service availability across all 7 regions has been implemented. The first step of the QIP is to identify the gaps in services.
One aspect of identifying the gaps is to analyze access statewide. As the graphic chart below indicates the number of Medicaid members under the age of 18 that received outpatient services has varied over the last 16 quarters with the highest number being 18,105 in April – June 2019, and the lowest number of 15,501 in July – Sept 2022. An analysis for the past quarters indicates that the average number of children and youth receiving services per quarter is approximately 16,800 (bold black line). For the most recent 5 quarters the number accessing services has been trending below the average.
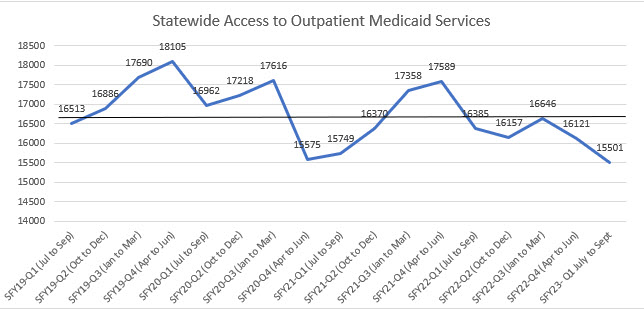
E3 Average Medicaid Outpatient Expenditure Per Distinct User by Region
An analysis of Medicaid outpatient expenditure by region indicates that there is substantial variation in expenditures across the state – from $94 per person served in Region 7 to $43 per person served in Region 5.
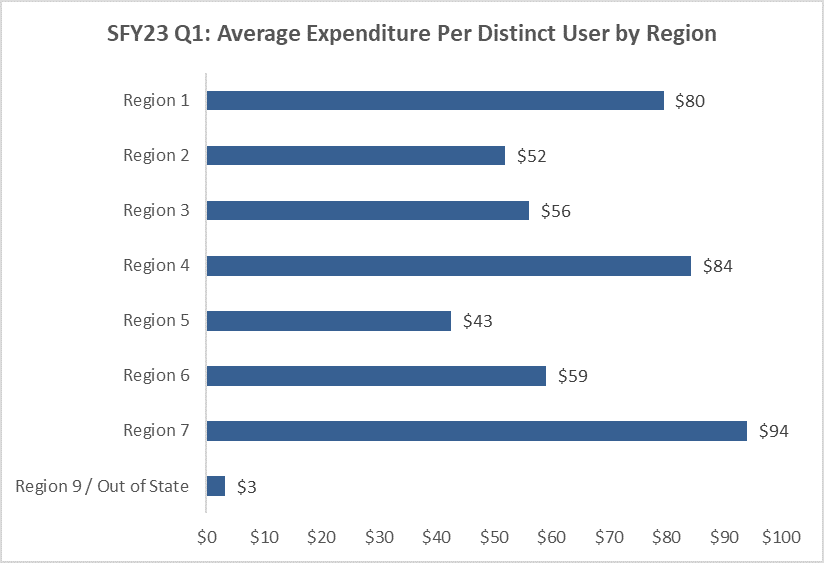
E4 Access to Intensive Outpatient Medicaid Services by Type and Region
Based on data about access to services and on-going concerns from families and advocacy groups, the QMIA Council recommended to the YES Sponsors and Defendants Workgroup (DWG) that a QIP be implemented for services needed specifically for children and youth with complex/high needs.
The following tables show the number serviced and the penetration rate (number receiving services/number of Medicaid members) for outpatient services provided to Medicaid members under the age of 18, with rates noted by type of service and by the region in which the service was delivered.
# of Medicaid Members Accessing Intensive Outpatient Treatment Services | |||||||||
1 | 2 | 3 | 4 | 5 | 6 | 7 | 9 | Total | |
TASSP[1] | 0 | 0 | 0 | 0 | 0 | 0 | 19 | 0 | 19 |
Partial Hospitalization (PHP) | 0 | 0 | 29 | 39 | 4 | 0 | 6 | 0 | 78 |
Day Treatment | 0 | 0 | 1 | 1 | 12 | 1 | 9 | 0 | 24 |
IHCBS[2] | 0 | 0 | 4 | 8 | 1 | 16 | 5 | 0 | 34 |
Penetration Rates for Intensive Outpatient Treatment Services | |||||||||
1 | 2 | 3 | 4 | 5 | 6 | 7 | 9 | Total | |
TASSP | 0.0% | 0.0% | 0.0% | 0.0% | 0.0% | 0.0% | 0.5% | 0.0% | 0.0% |
Partial Hospitalization (PHP) | 0.0% | 0.0% | 0.1% | 0.1% | 0.0% | 0.0% | 0.0% | 0.0% | 0.0% |
Day Treatment | 0.0% | 0.0% | 0.0% | 0.0% | 0.0% | 0.0% | 0.0% | 0.0% | 0.0% |
IHCBS | 0.0% | 0.0% | 0.0% | 0.0% | 0.0% | 0.1% | 0.0% | 0.0% | 0.0% |
[1] TASSP- Therapeutic After School Support Program
[2] IHCBS – Intensive Home and Community Based Services
Short term goals for the QIP are to define the population, identify missing and needed services, identify the reason why services are not available and research interventions used in other states that have been successful in responding to this issue.
E5 Quality Improvement Projects (QIPs)
Crisis and Safety Plans
To help families with the need for higher quality, effective Crisis and Safety Plans, the Division of Behavioral Health implemented a QIP.
In SFY 2021, standardized forms for crisis and safety planning, and other helpful information related to a crisis, were added to the Youth Empowerment Services (YES) website. In addition, a collaborative workgroup of parents and youth, the IDHW Divisions of Behavioral Health and Family and Community Services, and the Idaho Department of Juvenile Corrections, and SDE created a video for youth and parents about how to create an effective crisis and safety plan. The video is available in English and Spanish on YouTube and the YES website ( https://yes.idaho.gov/).
In SFY 2022, training for community providers on the creation and use of effective safety planning was provided in five total sessions. Attendance at the training was very good with over 500 participants. Based on the 2022 family survey[1], there has not yet been an improvement in the effectiveness of crisis safety plans (still at 60%), however the training took place later in the FY, so it is possible that there will be more of an impact that can be evaluated in SFY 2023.
The Crisis and Safety plan training provided in the fall of 2022, was based on recommendations from family representatives on the Family Advisory Subcommittee (Q-FAS), families gave input on the training and participated in the fall training. We will continue to collect data about the issue of Crisis and Safety Plans through the survey sent to families each spring.
[1] A YES Family Survey is conducted annually to assess the YES Principles of Care
Hospital Discharge Standard
Over the past years, there have been several complaints related to children/youth being discharged home without families having input on the discharge plan. During SFY 2022, a small workgroup ( DBH Quality staff and Family Members from the Council) began research into the development of a hospital discharge standard. The workgroup’s goal was to draft a standard based on policies, guidelines best practices and rules in other states and to propose a new standard be adopted by Idaho and used by Idaho’s’ community hospitals. This team felt that “Transitions of Care” would be a more appropriate name for this standard as there are times in which individuals require a higher level of care. A draft of this Behavioral Health Transitions of Care standard was forwarded to the DBH Policy Unit for review on June 27, 2022. The proposed standard has not yet been adopted.
YES reports:
The following are links to the YES reports noted within the QMIA-Q
QMIA-Q historical reports: https://yes.idaho.gov/yes-quality-management-improvement-and-accountability/
YES Rights and Resolutions: https://yes.idaho.gov/yes-quality-management-improvement-and-accountability/, click on “Additional QMIA Data and Reports” and scroll down the page
Quality Review (QR): Provider Survey; https://yes.idaho.gov/youth-empowerment-services/about-yes/yes-history/?target=8
YES Family Survey Results : https://yes.idaho.gov/youth-empowerment-services/about-yes/yes-history/?target=8
Review the full SFY 2023 Quarter 1 QMIA report here.
Review the Quarterly Utilization by Service Spreadsheet for SFY 2023 Quarter 1
Executive Summary – Q4
Total Number of Medicaid Members Accessing YES Outpatient Medicaid Services
The number of Medicaid members under the age of 18 served has varied over the last 16 quarters with the high number being 18,097 in April – June 2019, and the low of 15,289 in October – December of 2021. The overall trend had varied but the average number of children and youth receiving services is 16,809. There was a notable decrease in April to June of 2020 (shown by solid green line) which may have been due in part to COVID 19.
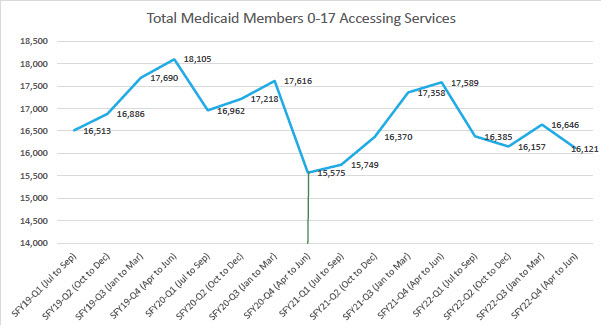
Statewide Access to YES Outpatient Medicaid by Service Type and Region
The following table shows the utilization of outpatient services provided to Medicaid members under the age of 18 are noted by type of service and the region in which the service is delivered. The number served is unduplicated within the specific category of services (e.g., the number children and youth who received that specific service).
Outpatient services CANS Assessments, Psych and Neuropsych Testing, Psychotherapy, Medication Management, Skills Building, Targeted Care Coordination, Substance Use, Crisis Intervention, Child and Family Interdisciplinary Teams are available statewide. Behavior Assessments, Skills Training and Development (STAD), and Behavioral Modification and Consultation are not available statewide.
Intensive outpatient services such as Partial Hospitalization, Day Treatment, and Intensive home and Community based services are not available statewide and overall appear to be very limited even in regions in which they are available.
It is notable that intensive outpatient services in Regions 1 and 2 appear to be the most limited.
| SFY 2022 | 1 | 2 | 3 | 4 | 5 | 6 | 7 | Out of state | Total |
| Distinct Utilizers | Distinct Utilizers | Distinct Utilizers | Distinct Utilizers | Distinct Utilizers | Distinct Utilizers | Distinct Utilizers | Distinct Utilizers | Distinct Utilizers | |
| Assessments | |||||||||
| CANS- Billed to Medicaid | 124 | 324 | 2,746 | 3,381 | 1,412 | 774 | 2,959 | 37 | 12,754 |
| Psych and Neuropsych Testing | 238 | 77 | 361 | 470 | 173 | 294 | 723 | 6 | 2339 |
| Behavior Assessment | 70 | 1 | 20 | 68 | 0 | 0 | 0 | 0 | 157 |
| Outpatient Treatment Services | |||||||||
| Psychotherapy | 1,981 | 669 | 4,020 | 4,831 | 2,136 | 1,262 | 4,055 | 83 | 18,742 |
| Med Management | 207 | 210 | 1,164 | 1,453 | 378 | 435 | 807 | 18 | 4,598 |
| Skills Building (CBRS) | 132 | 128 | 418 | 680 | 96 | 178 | 1,109 | 11 | 2,711 |
| Targeted Care Coordination (TCC) | 27 | 51 | 138 | 265 | 87 | 134 | 591 | 11 | 1,283 |
| Substance Use Services | 57 | 12 | 105 | 96 | 168 | 57 | 279 | 4 | 771 |
| Crisis Intervention | 44 | 26 | 38 | 36 | 27 | 21 | 239 | 1 | 432 |
| Child and Family Interdisciplinary Team (CFIT) | 33 | 26 | 36 | 82 | 70 | 40 | 118 | 0 | 402 |
| Skills Training and Development (STAD) | 0 | 30 | 2 | 3 | 135 | 4 | 107 | 1 | 281 |
| Behavior Modification and Consultation | 73 | 1 | 18 | 54 | 0 | 0 | 0 | 0 | 144 |
| Intensive Outpatient Treatment Services | |||||||||
| Partial Hospitalization (PHP) | 0 | 1 | 11 | 155 | 8 | 5 | 22 | 1 | 301 |
| Day Treatment | 0 | 0 | 2 | 5 | 31 | 4 | 31 | 1 | 73 |
| Intensive Home and Community Based Services (IHCBS) | 0 | 0 | 5 | 17 | 0 | 28 | 10 | 0 | 60 |
| Support services | |||||||||
| Respite | 6 | 64 | 103 | 195 | 40 | 67 | 238 | 4 | 705 |
| Youth Support Services | 4 | 22 | 65 | 219 | 96 | 45 | 125 | 3 | 572 |
| Family Psychoeducation | 29 | 0 | 11 | 27 | 122 | 2 | 18 | 0 | 209 |
Quality Improvement Projects (QIPs)
Crisis and Safety Plans
To help families with the need for higher quality, effective Crisis and Safety Plans, the Division of Behavioral Health implemented a QIP.
In SFY 2021, standardized forms for crisis and safety planning, and other helpful information related to a crisis, were added to the Youth Empowerment Services (YES) website. In addition, a collaborative workgroup of parents and youth, the divisions of Behavioral Health and Family and Community Services, and the Idaho Department of Juvenile Corrections, and SDE created a video for youth and parents about how to create an effective crisis and safety plan. The video is available in English and Spanish on YouTube and the YES website.
In SFY 2022, training for community providers on the creation and use of effective safety planning was provided in three sessions. Attendance at the training was very good with over 300 participants. Based on the 2022 family survey, there has not yet been an improvement in the effectiveness of crisis safety plans (still at 60%), however the training took place later in the FY, so it is possible that there will be more of an impact that can be evaluated in SFY 2023.
Additional training is being provided in the fall of 2022. Based on recommendations from family representatives on the Family Advisory Subcommittee (Q-FAS), families will give input on the training and will participate in the fall training. We will continue to collect data about the issue of Crisis and Safety Plans through the survey sent to families each spring.
YES Service Availability in all 7 Regions
The QMIA Council recommendations listed in the QMIA-Q report for YES quality improvement based on data SFY 2021 were reviewed by the Defendants Workgroup (DWG) and a determination was made to focus on the following as a
priority:
“YES partners will develop a plan for increasing service availability and access in all 7 regions with a goal to increase access statewide. “
The Council has drafted a QIP to address the recommendation was approved by the Defendants Work Group (DWG).
Short Term Actions are listed below:
| Short Term Actions | Lead | Timeline | Status |
| Identify gaps in services by service type and by region | Candace | Nov 30, 2022 | Services gaps type and region are reported quarterly in the QMIA-Q. New data regarding penetration rates has been added to the report. Evaluation based on penetration rates will be include as of SFY 2023 Q1 |
| Identify which services to target | Candace | Dec 31, 2022 | On-going analysis is in progress |
| Develop plan to assess why services are not available- availability, capacity or other | Candace | Dec 31, 2022 | Draft plan in progress 1) Add to QR – completed 2) Added this into University RFP |
Hospital Discharge Standard
Over the past years, there have been several complaints related to children/youth being discharged home without families having input on the discharge plan. During SFY 2022, a small workgroup began research into the development of a hospital discharge standard. Their goal was to draft a standard based on policies, guidelines best practice and rules in other states and propose this new standard be adopted by Idaho and used by Idaho’s’ community hospitals. This team felt that “Transitions of Care” would be a more appropriate name for this standard as there are times in which individuals require a higher level of care. A draft of this Behavioral Health Transitions of Care standard was forwarded to the DBH Policy Unit for review on June 27, 2022. The proposed standard has not been adopted yet.
QMIA Council recommendations for QIP SFY 2023
Based on data about access to services and on-going concerns from families and advocacy groups, the QMIA Council has recommended to the YES Sponsors and Defendants Workgroup (DWG ) that a QIP be implemented for services needed specifically for children and youth with complex/high needs. Several interventions have already been implemented including training on Therapeutic Behavioral Services (an intervention within Intensive Home and Community Based Services), development of agencies to re-introduce Therapeutic Foster Care. Short term goals for the QIP are to define the population, identify missing and needed services, identify the reason why services are not available and research interventions used in other states that have been successful in responding to this issue.
New data:
Monitoring by Percent of Utilization (Penetration*) rate
New data that is being added to the QMIA-Q for SFY 2022 is the percent of Medicaid members by region that access services. This rate or utilization, also called “penetration rate” is calculated by using the number reviewed services divided by the total number of Medicaid members. Using a penetration rate allows the state to do a comparison between regions that is standardized rather than based on number served.
One example of this data is included below. Based on the predictive models for Idaho, the penetration rate for psychotherapy that is desired is at least 8 percent. Over the past 16 quarters, the median** rate has been 6.25 percent.
Currently the penetration rate is trending down. The high of 7.2 percent was in Q3 of 2020 and there have been 9 quarters of lower rates since that time. The decrease is most likely due to workforce shortages across the state.
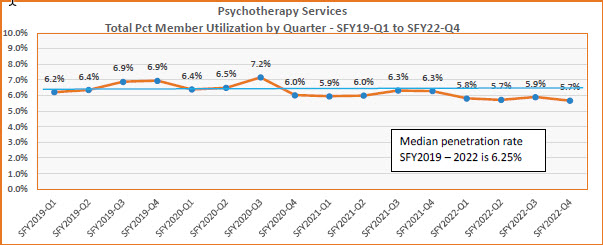
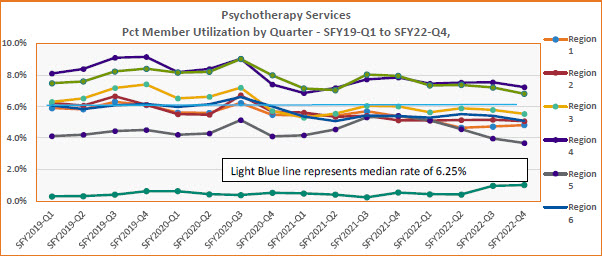
* Penetration Rate – Percent of the relevant population that has accessed the service at least once in the time period under study.
** Median – The value lying at the midpoint of observed values.
In this section, you can view additional data and documents related to Quality Management Improvement and Accountability (QMIA) published before July 2022. Included are the YES QMIA Plan, Quarterly QMIA, Wraparound Intensive Services (WInS), and Rights and Resolutions Reports, as well as annual estimates of the YES Class Size.
You can also view all QMIA Quarterly Reports published before July 2022. For QMIA Quarterly Reports published after July 2022, select the QMIA Quarterly Reports tab.